Curretnly i m working on the Graphs in XIR2. In this i am able to design the graph and not able to get the line in the graph as per the requirment. Can any one please suggest me on this. Please find the attachemtn for more details. Content.doc (27.0 KB)
Unfortunately, WebI does not allow multiple chart format to be mixed in a single chart. But you may add a mesure to one chart and document it in the legend.
Please see the attached screenshot for an example of using a bar/line chart and using the line with a runningsum on the average (cumulative average functionality). Note the use of adding “col” within the formula. You can omit “col” in a normal grid-type of work, however, when you want to apply a column of metrics within a graph you sometimes need to include this feature.
You’ll notice the effect of dropping the values of the bar and line on chart as some numbers and percent values are sitting too close to each other. I’m not sure how to go about making that part look better so in the end you might wind up dropping your grid into an Excel spreadsheet to finalize your product simply due to the lack of formatting capability afforded in WebI (hint, hint Business Objects, we need help here).
You can define multiple measure objects.
As in the doucment you mentioned, create measures for Storage Problems, Transport Issues, Glass Defects and Handling pacakges.
 (BOB member since 2007-07-11)
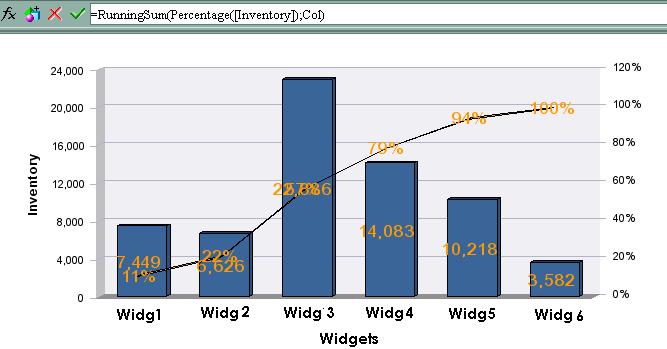
 (BOB member since 2006-08-31)