Hi there
I have a requirements explained below.
I need to show map on a dashboard and circles on the countries.
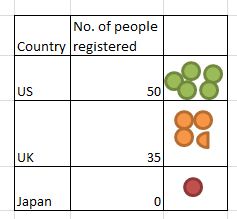
if for US , the number of people registered are 30 then i need to show three circles on that region (each circle represents 10 and each half represents 5).
and I need to apply conditional formatting on these circles. What ever the value I get I divide it by 10 and show those many circles.
Is this possible ?? Please see attached sample data.
Thanks in advance
Asmitha

Asmitha ![]() (BOB member since 2008-06-06)
(BOB member since 2008-06-06)
 (BOB member since 2008-06-05)