I’ve had a little search to see if this is possible to do but the messages I’m seeing is that it’s not - however, that was back in 2009 and haven’t seen anything more up to date
Is it yet possible to do a grouped vertical bar chart with line?
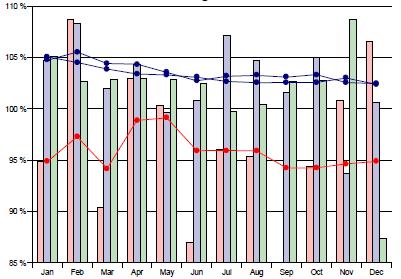
I’ve attached an example of the charts we had in Deski before the conversion.
Unfortunately nothing has changed since your 2009 search. For what it is worth 4.0 is suppose to have additional visualizations for graphing. From what I’ve seen they are usless but look cool none the less.
Thanks for your reply though. It’s odd as the reports have been converted from Deski to Webi and some of the graphs have multiple bars but with one line and other graphs just haven’t converted at all
Thanks for your reply, unfortunately it doesn’t as we have three years worth of data we need to show with 3 bars and 3 lines per month
Just an update, we have found a workaround to do this, not ideal but it seems to have solved the immediate problem. I now have 6 measures 3 separate ones for each year for the bar and 3 separate ones for each year for the line
I am experiencing the same issue in Webi version 4 sp04. I need to create a bar chart with 2 measures and line chart with another2 measures. When I group them in the bar/line chart, it takes only one measure for the bar and the remaining 3 for the line! It is odd!

 (BOB member since 2003-02-13)
 (BOB member since 2010-08-11)
 (BOB member since 2009-02-24)
 (BOB member since 2007-09-06)