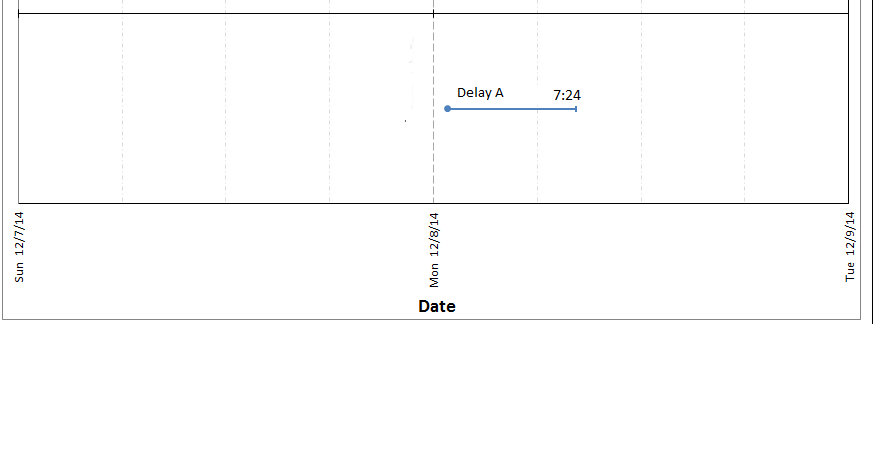
Guys,
I have a challenge where I wish to create a ‘timeline’ chart in either Web-i or Dashboards. As you can see from the below screenshot (from XLS), I have a starttime and and an endtime of a ‘Delay’. From what I can see from researching Webi, this isnt yet possible, but is it possible in Dashboards?
My apologies for a post with little info but any ideas or work arounds would be great… Dashboards 4.1, BI 4.1

fghs_1987  (BOB member since 2008-01-02)

 (BOB member since 2005-03-01)