Hi ,
Is stacked bar with line chart is available in 4.0? i have webi user guide but i couldn’t find anything related to it.
Regards
Harish
harishreddy  (BOB member since 2006-05-11)
Hi ,
Is stacked bar with line chart is available in 4.0? i have webi user guide but i couldn’t find anything related to it.
Regards
Harish
harishreddy (BOB member since 2006-05-11)
I just checked, and no, it’s not there. But then, we didn’t have that in XI 3.x either.
MichaelWelter  (BOB member since 2002-08-08)
Thanks Michael.
Regards
Harish
harishreddy (BOB member since 2006-05-11)
I was able to create a stack bar with line char in 4.0. There is no template for it but you can basically turn a column bars into a stack bar in the Value axis properties.
Rayden (BOB member since 2010-01-27)
Hey Rayden,
I’m also trying to get a stacked bar with a line but i do not really understand your solution; can you clarify abit?
What properties are you referring to?
Any help would be greatly appriciated
Kind regards
Erik
ErikB (BOB member since 2012-11-01)
Hi Rayden,
Can you explain further on turn a column bars into a stack bar in the Value axis properties.
Thanks,
sujathaparuchuri (BOB member since 2007-03-01)
Hi,
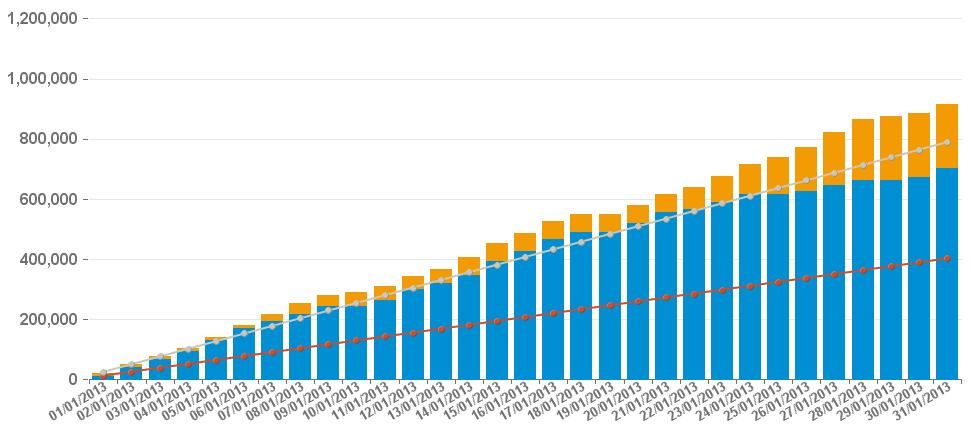
Just to clarify; Please find attached graph.
If you want to achieve a graph similar to the attached, then:
1- Create your stack column chart
2- Right-click on the chart, go to format chart
3- Go to Global → Region Type
4- Change the relevant measure to a line by changing the default value to “lines”
and you will have a stack bar chart with lines
Rayden (BOB member since 2010-01-27)
Hi Rayden,
Tested and worked. Thanks for the extra info.
Kind Regards
Erik
ErikB (BOB member since 2012-11-01)
Hi Rayden,
Many thanks for this work around , but if we would like to show another axis for Line chart, would it possible?
Thanks
mnarne ![]() (BOB member since 2007-09-17)
(BOB member since 2007-09-17)
Hi,
is this available on 3.1 also ?
Thanks
Rogerio
rgoulart  (BOB member since 2011-08-21)
Not in 3.x. Yes in 4.x- workflow is same but turn into Combined Column and Line Chart with Dual Value Axes first
matt1306 (BOB member since 2005-08-09)
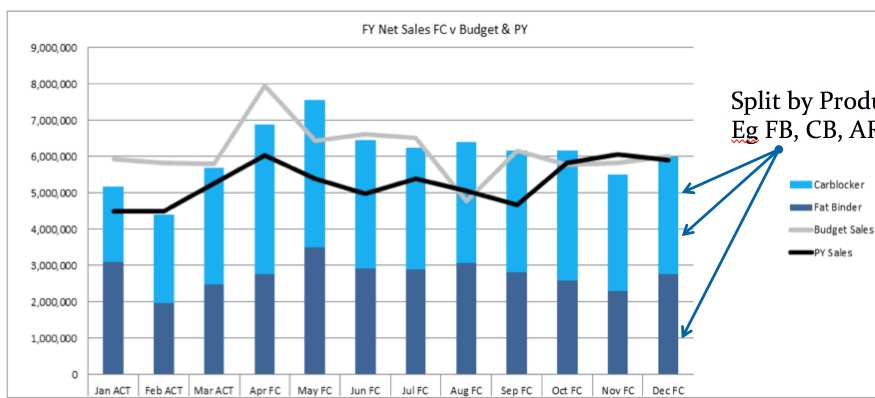
You could have those by just creating a combined chart, or a combined chart with dual axis.
Will it be possible to have the Region Type just applied on the bar chart and not on the lines?
I have tried several things but didn’t manage to get it working.
Please have a look at what it should look like as a result.
jornvdd ![]() (BOB member since 2003-06-24)
(BOB member since 2003-06-24)
Have you tried use dual axes but hiding value axis 2? Under Global -> Region type, set both series on value axis 1 to line and both series on value axis 2 to bar. Finally, try setting value axis 2 to “Globally stacked”. In assign data you may need to set region color to “Measure Names”
matt1306 (BOB member since 2005-08-09)
Hi,
Is it possible to create Combination of Stacked bar and Column Chart instead of line chart?
I have a Product dimension, Let say ProductX which goes on X Axis. On my Y axis I need to show 4 measures- ActualSales14, EstimatedSales14 on one STacked Bar and ActualSales16, EstimatedSales16 for 2nd Stacked bar for this Product X.
The 2 stacked bars for this product X are beside each other, hence its a combination of Stacked Bar and column chart
karna  (BOB member since 2010-03-07)