Hi All,
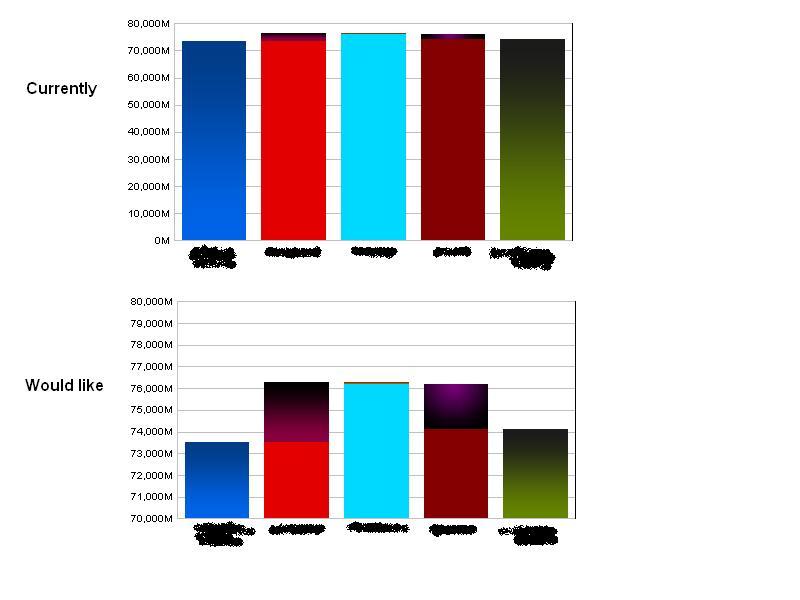
I have a stacked bar chart (see attachment) and it looks like the top image. My issue is that some of the stacked values are very small and I would like to ‘auto-scale’ the y-axis so that they are clearer - as in my second image. I got the second chart to look like that by manuallly going into Chart-Expert and changing the Min and Max values of the chart. However, the report is parameter driven and the values on the chart will vary a lot so I can’t manually fix a Min value on the chart.
What I need is for the chart to auto-scale to a reasonable level so that all stacked values are clear. I don’t think it’s possible but was hoping I’ve overlooked something? Anyone any ideas?
Thanks.
chesl73 (BOB member since 2008-05-15)