I have a spreadsheet style report for the most part it was plain and easy.
Now, I need to interject additional objects to the report but the request is to make the objects act as Column headers and within each column header there is a row value based on another object!
Getting confused on trying to do this, first thought of Crosstab but can’t get it to align correctly. Next tried to section it out but users don’t want to see this as the rows for each section can and will be duplicated over and over for each section.
Running out of ideas so am reaching out to the gurus here to lend a hand with prior reporting experiences similar.
To visualize this is what it needs to look like…
Column…Column…Column(Object value)…Column(Object value)
obj…obj…object(based on another object)…
if there are ambiguous values, then you have to made it unique in your formula with min(), max(), first(), last()
and/or with exact calculation-context
There may be more than one value so if there are they would need to appear in subsequent columns across the report.
Not only that within each of those columns there may be a value result from another field!
This makes it a more intense report to create
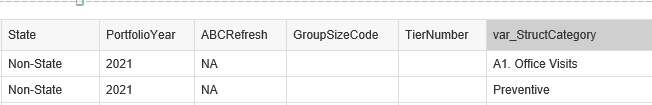
The report should look like this with the var_StructCategory values going across as COLUMN Headings.
Underneath those Categories I need to insert other values that relate to each of the StructCategories
I know it may be easy for some but keep getting MULTVALUES or appearance not what I want…
the example does not show us your problem.
this is only some simple data that can easy be converted into crosstab
first try adding all fields into a vertical table and check if everything is displayed correctly before doing some crosstab.
then build a crosstab from scratch, step by step adding fields.
if something is going wrong, edit the formula of this field or try to move the value/formula to a variable.

 (BOB member since 2018-12-29)