Is there any option to reverse the series on the axis in a Graph in Web Intelligence XI 3.1? e.g. if the Y- Series from top to bottom in graph is being shown as 4,3,2,1,0,-1,-2,-3,-4 then it should be shown as -4,-3,-2,-1,0,1,2,3,4.
I tried this work around but still its not behaving as you mentioned because if you put a ‘-’ sign for formatting the values then for positive values it shows positive but for negative values also it is showing as positive so all values turns positive.
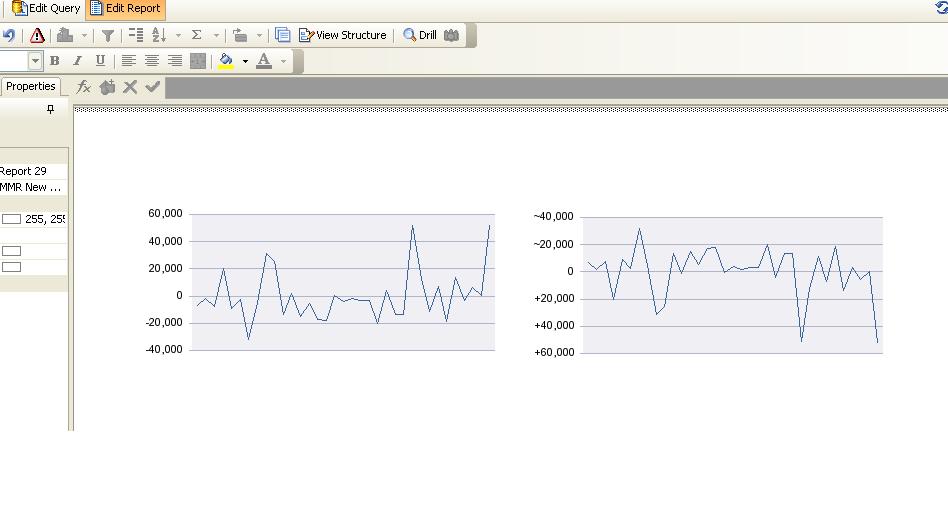
attached is what I was able to do with the above method: the graph on the left is the orginal data; the graph on the right is the flipped version.
Granted, for some reason BO doesn’t like using the ‘-’ sign in for formatting positive numbers… but it does allow using the tilde (~) which is a pretty good approximation of the minus sign.
Thank you very much for explaning the concept using image. I worked out by using ASCII 150 or even 151 character code which resembles a bigger ‘-’ sign. So this worked for me.
 (BOB member since 2008-11-06)