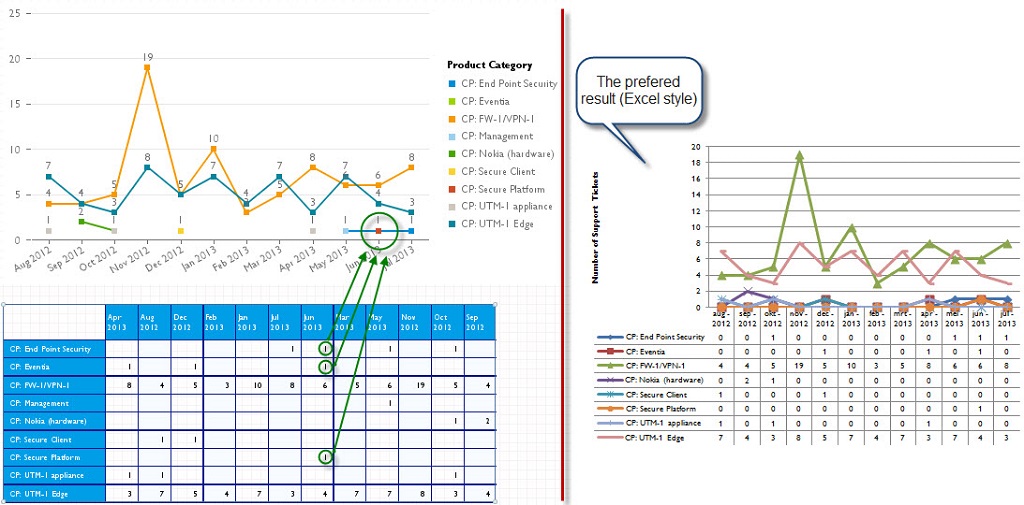
i’ve created a line chart in WeBI. The problem I’m facing is overlapping values.
In my case in June 2013 there are 3 Product Categories with the value 1. In the Line chart this is not clear for the human eye.
Are there any tricks I can apply to make it clear to the reader that there are 3 Product Categories with the value 1 in June 2013?
bas_vdl ![]() (BOB member since 2012-11-08)
(BOB member since 2012-11-08)
 (BOB member since 2010-05-03)