Not sure this is possible to achieve the following in a single table - Webi 3.1
I could do it in two myself, not a problem, but I need to see if it can be done in a single crosstab:
              |          Number of Calls Made             |          Number of Calls Answered         |
              | Jan | Feb | Mar | Apr | May | ..... | Dec | Jan | Feb | Mar | Apr | May | ..... | Dec |
Sales Person1 | 123 | xxx | ... and so on                 | 456 | yyy | ... and son on                |
Sales Person2 | 123 | xxx | ... and so on                 | 456 | yyy | ... and son on                |
Thanks in advance for your help - I may be missing something obvious but it wants to do Month then Calls Made and Calls Answered but won’t split out the other way round (as per above).
I don’t know a simple way of doing it, as effectively you want the value of your measure to act as a dimension (eg a dimension with the values of “Calls Answered” and “Calls Made”. Are the measures coming from the same query or separate ? If separate queries you may be able to use a local variable to identify the label.
I had a similar scenario which I resolved by using a table instead of a crosstab, and creating a multitude of variables in the report to pivot the measures (eg in your case Calls Made Jan, Calls Anwered Jan etc. As you have a finite number of dimension values (Jan - Dec) this would work for you, it’s just ugly
Yep, that’s what I feared. The big problem is that I expect them to want data at a daily level. That said, I can use the day offset approach for that so that’s still not too bad. You wouldn’t think that it’s beyond the capabilities of Webi though, would you?
You have to create a variables in the universe level.
Var1: SUM(case when date = jan then measure )
this might give you some idea. Here you need to create a 12 variables from jan - dec. Though this is a bit lengthy you can do it in cross tab itself.
get the measure values when the date is jan or what ever.
I have a similar issue, but I want to hide one of the months if the column is blank. Any ideas??? the crosstab property to hide a column when empty does not seem to work.
We have similar requirement for the XIR3 SP3 report format. One column is Price measure based on Product Type (P1, P2, P3) and the other column is quantity measure based on UOM (U1, U2, U3). For each product, user need to show all the price first and then UOM next.
I have the below objects in select:
Country|Division |Region | Bill no. | Bill amount | Bill date
I need the cross tab like below:
|Number of Bills |Total billed amount |
| Jan | Feb | Mar | Apr | May | ..... | Dec | Jan | Feb | Mar | Apr | May | ..... | Dec |
Country|Division |Region | 123 | xxx | ... and so on | 456 | yyy | ... and son on |
Country|Division |Region | 123 | xxx | ... and so on | 456 | yyy | ... and son on |
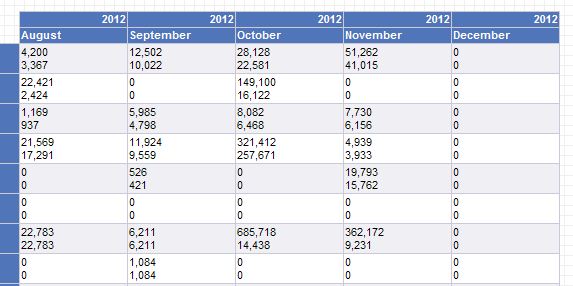
What I am getting is like this:
| Jan | Jan | Feb | Feb |.................. | Dec | Dec |
Country|Division |Region | 123 | 456 | xxx | xxx | ... and so on | | |
Country|Division |Region | 123 | 456 | xxx | xxx | ... and so on | | |
We have a requirement like this as well. We need to move BEx queries into a WEBI report and copy the layout.
There are only two dimension in the BEx: a range of months that’s determined at run time, and one a list of regions. Data is presented in a crosstab with the Region as the vertical axis. We need to display three kinds of measures.
When I lay down the report, the required behavior is as such:
         | Jan | Feb | Jan | Feb | Jan | Feb
Region 1 | Ms1 | Ms1 | Ms2 | Ms2 | Ms3 | Ms3
Region 2 | Ms1 | Ms1 | Ms2 | Ms2 | Ms3 | Ms3
The Jan-Feb is the month range and in this example and Ms1-3 represents the three kinds of measures that I need to show per region per month. However, the following happens in WEBI:
         | Jan | Jan | Jan | Feb | Feb | Feb
Region 1 | Ms1 | Ms2 | Ms3 | Ms1 | Ms2 | Ms3
Region 2 | Ms1 | Ms2 | Ms3 | Ms1 | Ms2 | Ms3
As you can see, it will just get the values of the three measures and arrange them for that month instead of being able to directly compare them to each other (that is, immediately be able to see the Ms1 difference between Jan and Feb).
What I did is use three cross tabs, aligned next to each other. I tried splitting the month dimension to try and get each individual month, but I will then face an issue due to the user potentially filtering for more than two months. I need to be able to do this in one cross tab so that if the user adds another dimension in the future, he can easily put said dimension in the report.

 (BOB member since 2010-09-07)
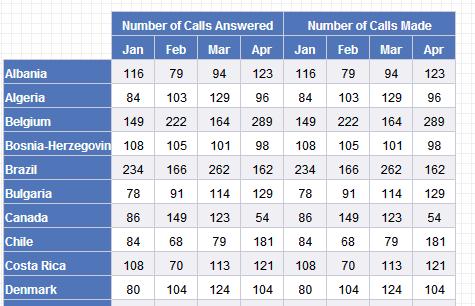
 (BOB member since 2006-12-08)
 (BOB member since 2008-12-18)