Hello Experts,
I think I have encountered the most complex chart to be developed in Webi. I have attached the chart that has basically 3 requirements.
-
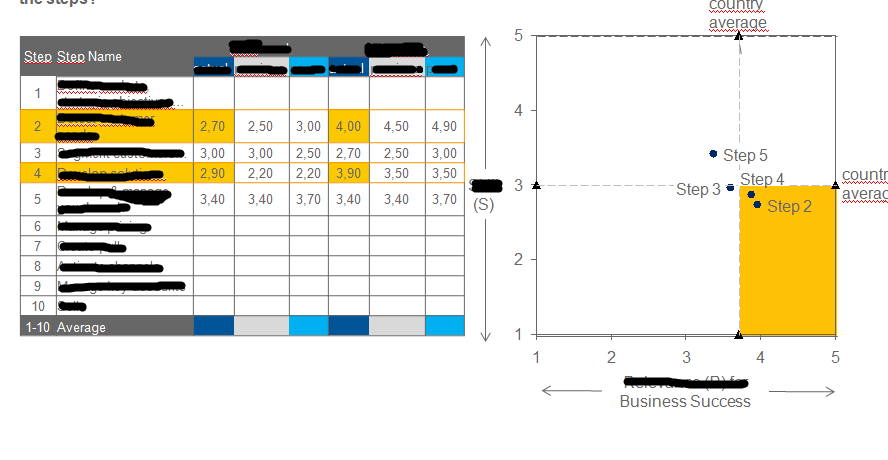
2 KPIs are on two axis. The average of both the KPIs will be have a bubble and to be shown in chart. This is very much achievable with bubble chart.
-
This both the KPIs are having 10 different steps and their values. The average of these 10 values needs to be shown as a line in chart.
-
The chart should also be color coded for the area which is lesser than threshold values.
Thanks in advance. Please provide any idea if you have.
Shyam_BO ![]() (BOB member since 2008-04-05)
(BOB member since 2008-04-05)