In the management console you can look at the data quality reports. For each match set you’ll be able to look at a match contribution report. This report shows you a summary of all the “rules” (criteria) and which ones are driving a match decision or a no-match decision. It’ll give you a detailed breakdown of your largest and smallest break groups along with the break key to help optimize your break key definition as well.
Let us know if this isn’t giving you specifically what you’re looking for and we can go from there.
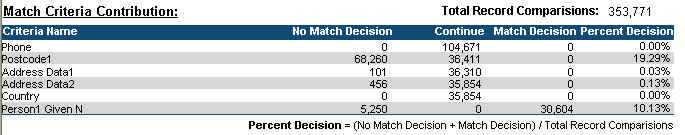
Thanks a lot for the information, this really helped to some extent. I was able to locate the Match cotribution report for each of the match rules we set. I am not very clear on how to read this report. It shows some match percentages. I want to be able to say x% of customers matched with this rule … then the next step would be how can I increase the match rate , and if the match rate is too low whether it makes sense remove it / modify it. I am attaching a snapshot of the match contribution table, would be great if you could briefly explain it.
Thanks a lot.
 (BOB member since 2010-03-05)