Hi Everyone,
I have a question regarding break in a Webi Reports
when adding a break to (Cross Table) we get this result ![]()
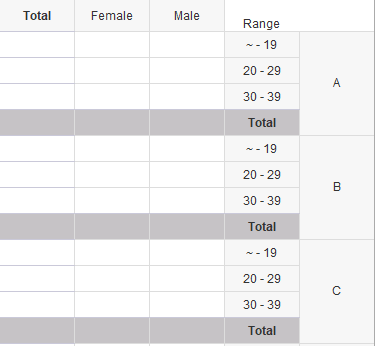
What should I do to get this result with the (All Values)
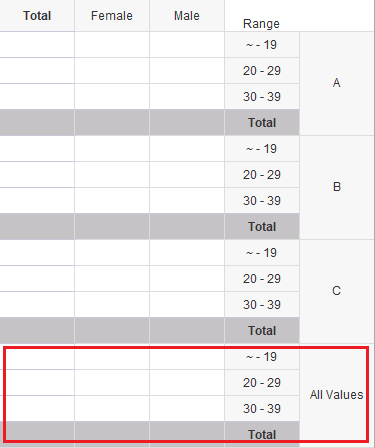
can this be done in a one table? any other Ideas?
Thanks
Hi Everyone,
I have a question regarding break in a Webi Reports
when adding a break to (Cross Table) we get this result ![]()
What should I do to get this result with the (All Values)
can this be done in a one table? any other Ideas?
Thanks
I would try adding another crosstab like the one you have except with no break and no column headers. If you align to be right next to the crosstab with the break I think that will give you your desired results.
I always add the rows for the amount of ‘groups’ I have, then add the count with context…
Obviously there are more rows above what is shown here, so the totals will not add up as seen.
Hi @nscheaffer 
Thanks alot for your reply,
this is the way i use right now , but it need more aligning for the tables, i was looking for a way that show the result in the same table.
Thanks again 
Hi @Bo_Bozo
Thanks for the Idea, this is good when we have a small number of groups, unfortunately, i have some table with more than 20 groups some with 30 groups, this will take time to create a unique formula for each group.
I may use this for tables with less than 5 groups
thanks again
Then I would default back to the methodology @nscheaffer incorporated. I’m not sure I understood the alignment concern you mention. I created a quick video of the process I believe @nscheaffer was relaying; however, the file type (mp4) is not allowing me to post.
Best of luck in your reporting endeavors.
For those with access to the SAP influence site, @Isa_Ashour submitted an enhancement request related to this.
https://influence.sap.com/sap/ino/#idea/268377.
I voted it up @Isa_Ashour 
Thanks @JohnBClark
