i want to represent sum of all the measures in report charts on top of each measure.
when i am trying to do it it’s not dispalying.
but whem i am creating sum with variable it’s dispalying but as a independent column, in report i want to show it on top without separate column.
any one has come across this issue.
Since you posted this in the Designer forum, can I assume you’re looking for a Designer solution rather than a Webi one?
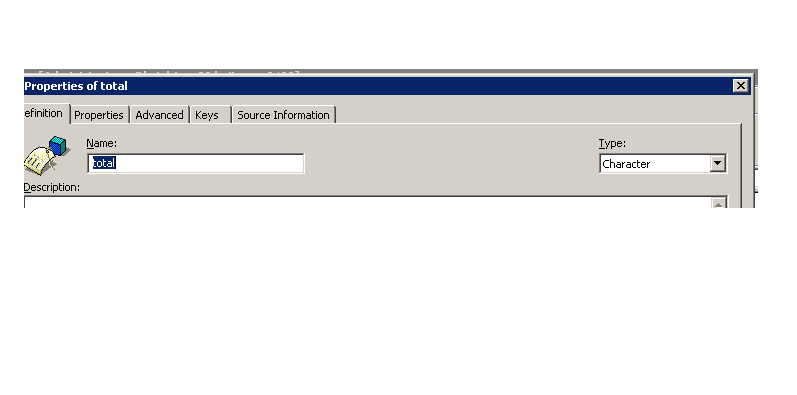
You can get there by using a union query after creating a special “Total” object in Designer. In the object, define it as a character field and put the string ‘Total’ or ‘Sum’ or whatever you want as the label. This object will not parse since it doesn’t reference a table.
Then, assuming your existing query has one dimension and a measure, here’s how you could create your graph. Edit your existing query and create a Combined Query - Union. Leave the first half of the query alone. On the second half of the union remove the dimension and replace it by the “Total” object created earlier. This will add the total line as a row in your result set, allowing you to include it on the graph.
(
SELECT
SapienceReportsDB.dbo.tbl_EmployeeTimeSpentData.sbuname,
sum(SapienceReportsDB.dbo.tbl_EmployeeTimeSpentData.onlineTime)
FROM
SapienceReportsDB.dbo.tbl_EmployeeTimeSpentData
UNION
SELECT
,
SapienceReportsDB.dbo.tbl_EmployeeTimeSpentData.onlineTime
FROM
sum( SapienceReportsDB.dbo.tbl_EmployeeTimeSpentData)
)
when i am running the above query it’s giving error saying incorrect syntax.that to “total” object which i have created is not showing in query because it doesnot reference any table.
There’s nothing there but a comma. Your Total object has to have something in the SELECT area of the object, usually a text value like ‘Total’ or something along those lines.
hi dave ,
i have created a character field named as “Total”, but while i am using it in webi query it showing syntax error because it doesn’t belonging to any table in the Database.
i even tried to create a custom SQL by keeping total as u specified but while parsing sql it’s showing syntax error.
What is the SQL that is being sent that is generating that error message? If it is the same as before, namely this:
(
SELECT
SapienceReportsDB.dbo.tbl_EmployeeTimeSpentData.sbuname,
sum(SapienceReportsDB.dbo.tbl_EmployeeTimeSpentData.onlineTime)
FROM
SapienceReportsDB.dbo.tbl_EmployeeTimeSpentData
UNION
SELECT
,
SapienceReportsDB.dbo.tbl_EmployeeTimeSpentData.onlineTime
FROM
sum( SapienceReportsDB.dbo.tbl_EmployeeTimeSpentData)
)
… then you have not defined the object correctly, as there should be something other than the , in the middle of that SQL statement.
hi dave,
i have created object “total” and defined it as a character field.
due to it doesn’t reference a table while i am draging that object in sql it’s generate like that comma only"," .
i have created object named “total” in designer and kept total in select class.
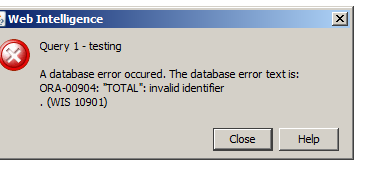
while running the query it is showing error:invalid identifier
query it is generating is:
(
SELECT
V_ZPROJECT.ZPROJECT,
STG_CONTRI.WTGBTR
FROM
V_ZPROJECT,
STG_CONTRI
WHERE
( V_ZPROJECT.ZPROJECT=STG_CONTRI.PROJECTID(+) )
UNION
SELECT
total,
STG_CONTRI.WTGBTR
FROM
STG_CONTRI
)
pleasec find attached error msg.
is there any way where we insert row and kept it as a sum on graph.
hi dave,
thanks for solution but the issue is i am not getting any row as a total. while i run the report getting only project id and wtgbtr amount(first half of query before union).
(
SELECT
STG_CONTRI.PROJECTID,
STG_CONTRI.WTGBTR
FROM
STG_CONTRI
UNION
SELECT
‘total’,
STG_CONTRI.WTGBTR
FROM
STG_CONTRI
)
it is just showing values from first half of query. didn’t get any row as total .
could you find the below thread regarding sum on top of graph.
hi dave,
thanks for solution but the issue is i am not getting any row as a total.while i run the report getting only project id and wtgbtr amount(first half of query before union).
(
SELECT
STG_CONTRI.PROJECTID,
STG_CONTRI.WTGBTR
FROM
STG_CONTRI
UNION
SELECT
‘total’,
STG_CONTRI.WTGBTR
FROM
STG_CONTRI
)
it is just showing values from first half of query. didn’t get any row as total .
could you find the below thread regarding sum on top of graph.
Your measure should have an aggregate function like sum(). It should not impact the steps for this solution, but it should be there…
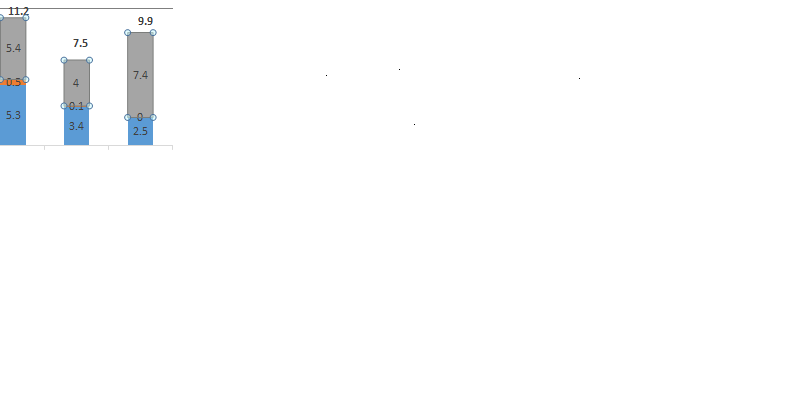
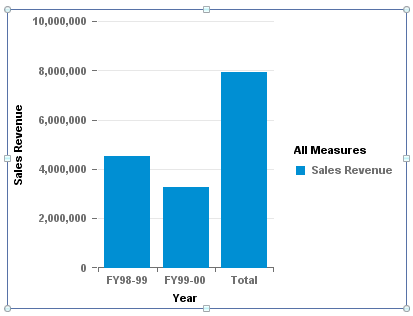
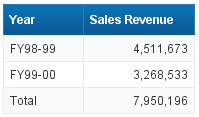
I opened the Motors universe and created an object called “Total” with the SQL definition of ‘Total’ and no where clause or table associated with it. I then created a query in Webi using the Fiscal Year + Sales Revenue and then union with the Total object and again with Sales Revenue. Here’s the SQL that was generated.
SELECT
  FINANCE_PERIOD.FP_YEAR,
  sum(((100-SALE_INVOICES.SALE_SALE_DISCOUNT)/100.0*MODEL.MODEL_PRICE)*SALE_INVOICE_LINES.SALE_QTY)
FROM
  FINANCE_PERIOD,
  MODEL,
  SALE  SALE_INVOICES,
  SALE_MODEL  SALE_INVOICE_LINES
WHERE
  ( SALE_INVOICES.SALE_DATE between FINANCE_PERIOD.FP_START and FINANCE_PERIOD.FP_END  )
  AND  ( SALE_INVOICES.SALE_ID=SALE_INVOICE_LINES.SALE_ID  )
  AND  ( MODEL.MODEL_ID=SALE_INVOICE_LINES.MODEL_ID  )
  AND  ( SALE_INVOICES.SALE_TYPE='S'  )
GROUP BY
  FINANCE_PERIOD.FP_YEAR
UNION
SELECT
  'Total',
  sum(((100-SALE_INVOICES.SALE_SALE_DISCOUNT)/100.0*MODEL.MODEL_PRICE)*SALE_INVOICE_LINES.SALE_QTY)
FROM
  MODEL,
  SALE  SALE_INVOICES,
  SALE_MODEL  SALE_INVOICE_LINES
WHERE
  ( SALE_INVOICES.SALE_ID=SALE_INVOICE_LINES.SALE_ID  )
  AND  ( MODEL.MODEL_ID=SALE_INVOICE_LINES.MODEL_ID  )
  AND  ( SALE_INVOICES.SALE_TYPE='S'  )
GROUP BY
  'Total'
I have attached images that show what the data looked like and after selecting “Turn to Chart” what the column chart looked like.
Those are the exact steps that I used. I am not sure why you’re not getting the expected results. I did the work with Universe Designer and Webi Rich Client, both in BI 4.0.
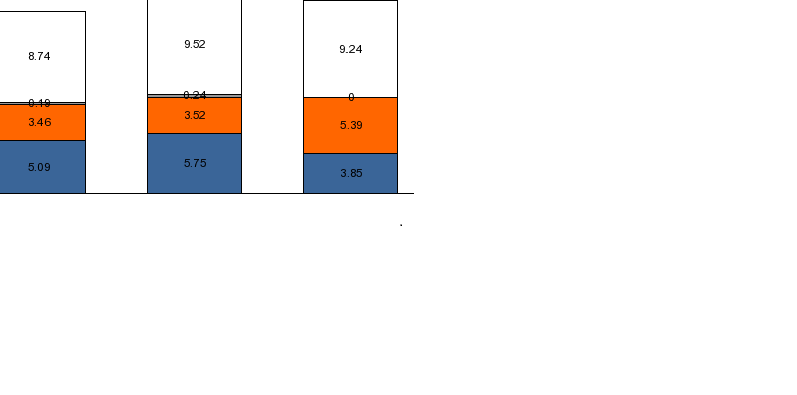
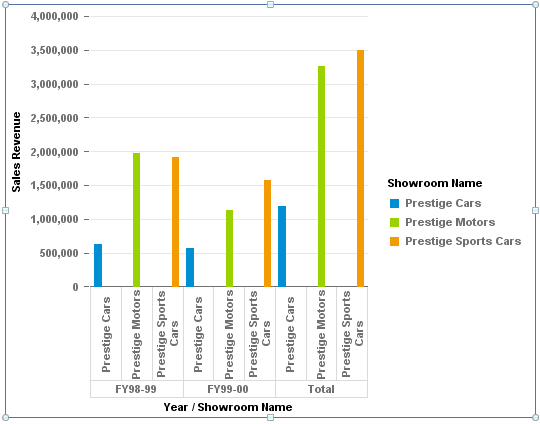
And here is one more image showing the same report, but this time with more than one dimension. Here’s the SQL code:
SELECT
  FINANCE_PERIOD.FP_YEAR,
  SHOWROOM.SHOWROOM_NAME,
  sum(((100-SALE_INVOICES.SALE_SALE_DISCOUNT)/100.0*MODEL.MODEL_PRICE)*SALE_INVOICE_LINES.SALE_QTY)
FROM
  FINANCE_PERIOD,
  SHOWROOM,
  MODEL,
  SALE  SALE_INVOICES,
  SALE_MODEL  SALE_INVOICE_LINES
WHERE
  ( SHOWROOM.SHOWROOM_ID=SALE_INVOICES.SHOWROOM_ID  )
  AND  ( SALE_INVOICES.SALE_DATE between FINANCE_PERIOD.FP_START and FINANCE_PERIOD.FP_END  )
  AND  ( SALE_INVOICES.SALE_ID=SALE_INVOICE_LINES.SALE_ID  )
  AND  ( MODEL.MODEL_ID=SALE_INVOICE_LINES.MODEL_ID  )
  AND  ( SALE_INVOICES.SALE_TYPE='S'  )
GROUP BY
  FINANCE_PERIOD.FP_YEAR,
  SHOWROOM.SHOWROOM_NAME
UNION
SELECT
  'Total',
  SHOWROOM.SHOWROOM_NAME,
  sum(((100-SALE_INVOICES.SALE_SALE_DISCOUNT)/100.0*MODEL.MODEL_PRICE)*SALE_INVOICE_LINES.SALE_QTY)
FROM
  SHOWROOM,
  MODEL,
  SALE  SALE_INVOICES,
  SALE_MODEL  SALE_INVOICE_LINES
WHERE
  ( SHOWROOM.SHOWROOM_ID=SALE_INVOICES.SHOWROOM_ID  )
  AND  ( SALE_INVOICES.SALE_ID=SALE_INVOICE_LINES.SALE_ID  )
  AND  ( MODEL.MODEL_ID=SALE_INVOICE_LINES.MODEL_ID  )
  AND  ( SALE_INVOICES.SALE_TYPE='S'  )
GROUP BY
  'Total',
  SHOWROOM.SHOWROOM_NAME
1., definition of Total object like ‘Total’ is not enough. It can work in some cases but not in generally.
you should use something like this
"case when STG_CONTRI.PROJECTID is null or STG_CONTRI.PROJECTID is not null then ‘Total’ end "
or something similar, but you should definitely use in the definition of Total object this column:STG_CONTRI.PROJECTID;if not, table STG_CONTRI can miss in the second part of query, query can use different joining path and return wrong results
2., 1st point can be also the reason why in both examples from Dave is in the second query missing table FINANCE_PERIOD and WHERE part ( SALE_INVOICES.SALE_DATE between FINANCE_PERIOD.FP_START and FINANCE_PERIOD.FP_END ).
I think that if you use this prompt during refresh of report, you will not get expected results for Total object
3., You must define measure as SUM(); I am not sure why and I dont have time to analyze into deep, but when I tested I received wrong results when not using sum()
 (BOB member since 2002-06-06)
 Your Total object has to have something in the SELECT area of the object, usually a text value like ‘Total’ or something along those lines.
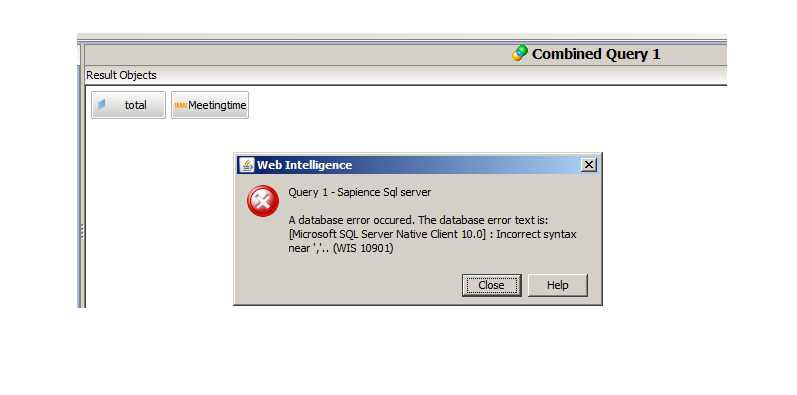

 (BOB member since 2011-01-15)