How to put different calculations on Breaks of same report

In my webi report, I have Month dimension(contains 12 jan 2014 to jan 2015) By default it shows all months data, I applied break by clicking on month, it inserted breaks for all months, my requirement is I need to apply diffrent functions(on jan 2014 “plus operation”, on feb 2014 “minus operation” like),
But when I apply any operation on one break it defaultly inserts to all breaks, please suggest me
Reply please
Screenshot.png


prabha_s (BOB member since 2015-01-26)

[Moderator Note: Moved from General Discussion to WebIntelligence XI]

And welcome to B:bob:B!


Marek Chladny :slovakia: (BOB member since 2003-11-27)

Try this:

Have an offset table built into your universe:
1 January 70
2 February 55
3 March 35
…etc

Then, create a second query with that data, merge into the first block, and have for your formula (approximately):

=[Offset]-(Sum[Ticket Count] Where [Month of…] = “January 2014”)


joel.maxuel :canada: (BOB member since 2015-01-14)

I created query with Months dimension and filter as “Last 12 months”,
In cross tab I dragged Months dimension. Now the columns as “January 2014” to “December 2014”. I have a requirement like I need to append a new column after each month column and there is a simple calculation like
1 ) For January 2014 (subtract all the values from 70) -->
70 - (corresponding value of January 2014)

2 ) For February 2014 (subtract all the values from 50) -->
50 - (corresponding value of February 2014)


n ) For December 2014 (subtract all the values from 40) -->
40 - (corresponding value of December 2014)

For this requirement I have added breaks depends on months dimension, It adds new column after each month column, but the problem is I could not apply different formula on each break column, for example if I apply the calculation like "70 minus(-) value of January 2014" on the break column of January 2014, this formula is applied to all break columns for all months (January 2014 to December 2014), Can we apply different formula on diffrent break columns, Please provide me the solution for this issue. It's urgent for me, Please

---

**prabha_s**  _(BOB member since 2015-01-26)_

The only way I can think of doing it is have one formula that works for all the months. If your offset value changes each month, include that in your query and subtract from it. See above for what I mean.

Alternatively, if you are just creating a report based on a fixed period of time (that is not bound to change), why bother with BO? Export your work thus far into Excel and finish the calculations by hand.

The second option may not sound reasonable, but think about it…you are creating a report that intentionally has the offsets hard-coded assuming the first column of the Xtab is January, and so forth. What if your boss wants July to June in 6 months time? Would you create a new report based off this one and hack the offsets to what they are now supposed to be? Does not seem reasonable (to me, any BO report you have to change the design of each quarter or fiscal is unreasonable). If the output is meant to be unchanging then best to finalize in Excel.

Or…

If you want to handle all time periods (thus always play with live data), build an offset measure into your universe.


If by chance the offsets are meant to stay independent of the data (so Feb 2014 - Jan 2015 range, starts with Feb 2014 and the new column would be 70 - [Feb 2014], 55 - [Feb 2014], 40 - [Feb 2014]), then that’s a different story. Will need a YearMonthNum in the universe, and hidden in the Xtab (column header, using left and right formulas giving the month number so for 201501 -> 2015x12 + 1 -> 24181), a variable determining the first value of them (eg. 201402 -> 2014x12 + 2 -> 24170), and a long-winded nest of comparison if’s to determine the offset value and subtract with it:

=if(left([YearMonthNum];4)x12+right([YearMonthNum];2)-[firstYearMonthNum] = 0;70 - first([Ticket Count]);if(left([YearMonthNum];4)x12+right([YearMonthNum];2)-[firstYearMonthNum] = 1;55 - first([Ticket Count]);if(left([YearMonthNum];4)x12+right([YearMonthNum];2)-[firstYearMonthNum] = 2;40 - first([Ticket Count]);… and so on until you get the 12th month.

Hope this helps.


joel.maxuel :canada: (BOB member since 2015-01-14)

Hi Joe, I also thought to put this calculation part on months in excel as every time there’s no guarantee to get all the months continuously, there may be a chance of missing some months in the selected duration of time.
For the requirement I mentioned which one is better for calculations

  1. In WEBI report itself
  2. In Excel

I dont know much about parature report tool, just created 6 webi reports only, I’m scheduling all these reports at certain date on each month or daily, when I receive these reports, in Excel these are opened in read mode, not allow me to edit it or add anything, may be this is a small silly question for you, but I dont aware all these stuff.

Can you provide some more details how to schedule in write mode so that all users can edit these reports according to their requirement.

Thanking you,
Prabha


prabha_s (BOB member since 2015-01-26)

Well, in Excel, you would be left doing it over and over again, each time the report is requested (Excel export would be just a dumb mirror of the BO report). If it a was a once a year thing, that would be reasonable to publish that way. Anything more often than quarterly, it’s a waste of your time. Thus, it would make sense to have BO to calculate for you, and you just push the report as needed.

As for read only access, should be able to save the excel, and then work with it.

Variables are pretty easy to set up, difficult to finesse. But the concern about months missing from the dataset shouldn’t be a problem, as your desired offset would be based off of either the month, or by how many months away it is from the first (as in not by the number of columns away it is).

Start by making sure a yyyymm (or similar, as long as it is numerical or can be numerical) field exists in your universe. From there, you can play around to see how months can interact with each other. If using WebI 4.x, the variables can be accessed in the panel on the left side, under available objects. Right click on Variables to create a new one.

Hope this helps with a start.


joel.maxuel :canada: (BOB member since 2015-01-14)

@prabha_s
This may or may not help…

Q. Is your data missing dates/weeks/months/years?
A. Use the TimeDim function! See here:
http://scn.sap.com/community/businessobjects-web-intelligence/blog/2014/12/03/demystifying-the-timedim-function


Darth Services :uk: (BOB member since 2007-11-20)

Hi,
Please observe the attached two files.
first_screen.png


prabha_s (BOB member since 2015-01-26)

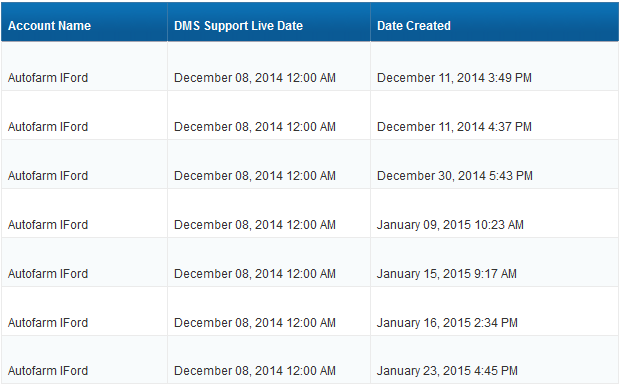
For " Autofarm Iford ", there exists a date(December 08,2014) in " DMS Support Live date " and there are seven tickets are created for this person(Autofarm Iford) on dates staring from (December 11,2013 to …January 23,2015), Please observe,

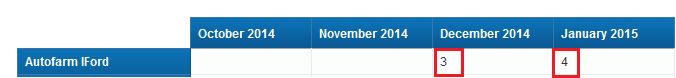
In the second screenshot the report showing " 3(in December 2014) " and " 4(in January 2015) "
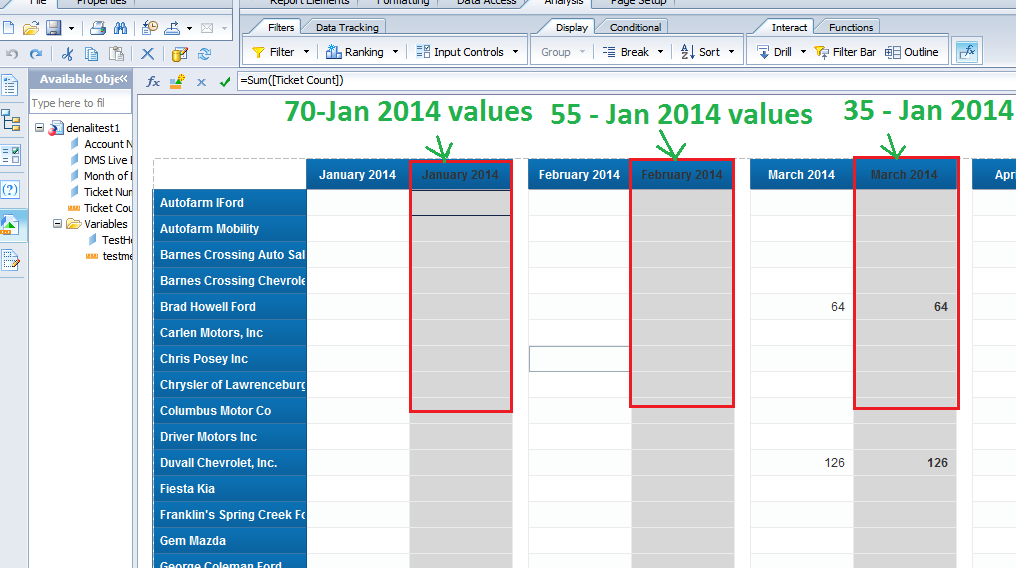
and the column headers are “October 2014, November 2014, December 2014, january 2015”, for these column headers I’m using the dimension(=[Month of Date Created]) and for the ticket count I’m using the measure (=[Ticket Count])
for the generation of this report(second screenshot I worked a lot…means removing the months from the report which are not in " DMS Support Live date "), and to not display ticket count for the dealer in the months of that dealer not available in " DMS Support Live date ".

Here my manager requirement is :
The number of ticket which I’m displaying like " 3 & 4 " will be calculated by starting the count of tickets on the DMS Support Live date through the next set of 30 days. We would like this to be a cumulative report, so, although a dealer may be 65 days after the DMS support Live date, we would continue to see the count of tickets from that dealer from days 0-30 and 31-60 as well as the current month which would be day 61-65 (in this example).

According to above requirement, I need to show the column header as ‘Month 1’, ‘Month 2’…
here Month1 should not be “December 2014”, It should be the time range from " December 08,2014 to January 08,2015 " and Month2 should be from “January 09,2015 to Febuary 09,2015”
Can I show the measure “[Ticket Count]” correctly under the new constructed columns(month1 and month2).

How can I create the dimensions (month1 and month2), please just suggest me, I know the question is very long, but I had to ask you, sorry I have no other option to do this report complete.
Please …
second_screenshot.png


prabha_s (BOB member since 2015-01-26)

Hi Joel,

Finally, I could complete the report .
Screenshot.png


prabha_s (BOB member since 2015-01-26)