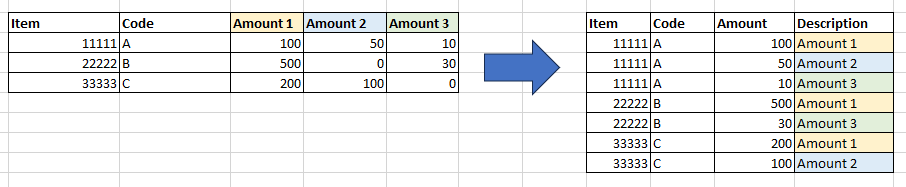
I’m trying to find a way in my report to pivot several amount columns in my report to individual rows, with the column header as a description in the row. Is there an easy way to do this? I made an example in excel of what my report currently looks like and what it needs to look like.
if you do these steps, I suppose it will work:
- make sure the (new) variable Description is of type “dimension”
- go “report element data”, “feeding panel” and choose under “turn into” the option “vertical table”
- place the variables accordingly
This report is already a vertical table. When I change it to a horizontal table, it puts each item in its own column, which is not what I need.
I think you need a cross table. Convert verticle to cross to have x and y values. and assign assign item and code on x, and amount as y, and adding an additional column next to amount, or use sum > for each row.