Hi,
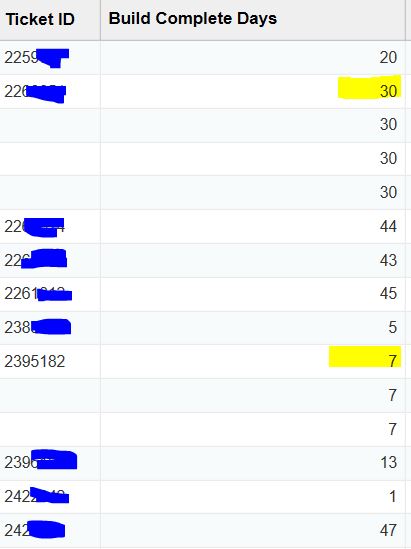
Please see the attached file. I want to get the lowest value (must be >0) for the number of completed build days for each ticket + add them up and divide them per distinct number of tickets that I have for the values (to get the average)
Can someone tell me how to do that in order to have the same avg value for both the table and a bar chart? The avg function in sap webi did not work! I wrote the following formula but it did not work either!
There is also a third column that says disease site, I want to show the avg per disease site on the chart. So, I created the below formula, used a bar chart, and for dimension pulled data from" disease site", and the formular below for the data values.
if you are stuck on this for 2 weeks, you could at least wait one day for a response
have you tried to use your formula in a variable and use this variable also in your chart?
did you check the parts of your formula separately, if all the sum and count do the calculation correct in the context?
you are talking about a “third” column in your table ?!
with “ForEach” you ADD a dimension to the calculation-context, I think this is not what you want to achieve.
you have to reduce the context with “ForAll” from unwanted dimensions (e.g. third column)
or … much better … set all the context explicit to the calc-relevant dimensions with In() , this will bring the result independently from using the variable in tables or charts
Hi,
So, if I use forall(), I am going to exclude a dimension that I have in the table from calculation?
I still don’t undrestand the difference between foreach(), and In(); can you please explain these more?
Thanks,
That has already been answered so often.
Please use Google or the search in this board. There are a lot of excellent answers + examples out there for all kind of SAP Software

 (BOB member since 2018-12-29)