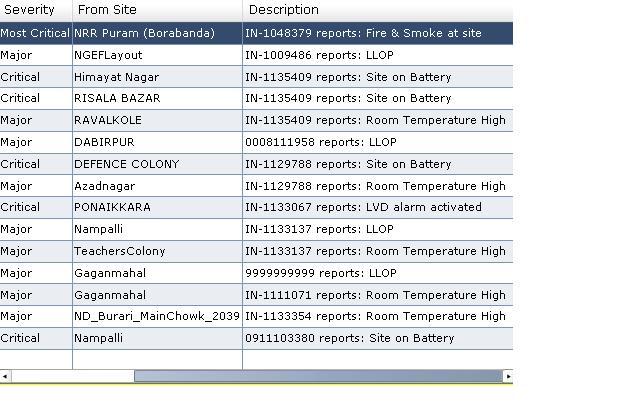
I am new with Xcelsius2008 and have little knowledge about it. Please find the attached file and just let me know the steps of how to create that. How to create the connection with database, how to fetch the data i.e. current last 15 rows, the colour scheme.
You are new to xcelsius, so I would suggest you to go through the basic design phase in the tool so that you can use components and bind them to data.
Summary of steps:-
Open the tool -> Drag the components in the right pane to the canvas (in center) -> check the properties of the component (in the right) -> In the properties, bind the data to the excel below.
For connections -> You can use the ones available in the “Connections” option.
For your case, I would recommend you to use “List View” component.
I have developed simple designs with spreadsheet only but here is the case to bind the live data and show them on the portal with flash.
We are using Oracle database. I have few questions:
After opening xcelsius, which connection need to use and how to connect with database.
Do I need to copy something in excel sheet of xcelsius?
I Will take ‘List View’ but how to link this ‘List View’ with database to get the attached information?
All Xcelsius components (such as bar charts, line charts, list view, etc.) must be bound to MS Excel cells
One can populate the MS Excel cells either manually (read: static data) or dynamically via Web Services (for example QaaWS via a universe), XML, BICS Bex queries, LiveOffice, etc.
I kindly suggest to read through the manuals and sign up for training
I am using web intelligence to create the reports based on universe. Here in this case I need to use xcelsius 2008. (didnt get the exact meaning of reporting layer).
According to my attachment, can someone suggest which service has been used to populate data dynamically?
 (BOB member since 2009-05-29)
 (BOB member since 2002-06-20)