Hello All,
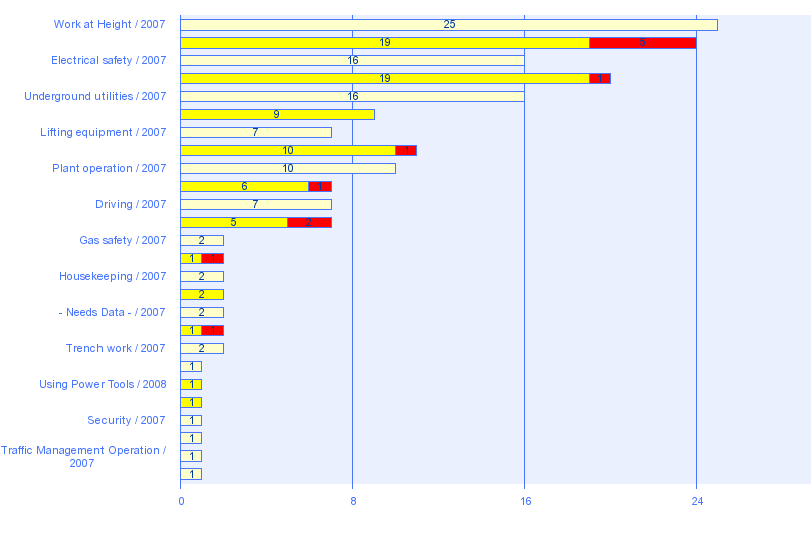
Attached is a chart showing a pale yellow bar for last year and a bright yellow bar for current year with a red section indicating last month. There are two bars per the main dimension, called Key Hazard.
My problem is that for some Key Hazard/ Year combinations there is no data, for example ‘Using Power Tools’ has no 2007 data but I want to show 0 for it, i.e. show a value on the axis regardless. Any ideas?
Thanks, Steve
PS. My other issue is that not all values show on the axis: the bar above ‘Using Power Tools / 2008’, for example, is for ‘Security / 2007’. We all know about the poor charting functionality with WebI though so I’m not expecting a solution to that other than “make it bigger”!. ![]()
steveayres ![]() (BOB member since 2006-11-23)
(BOB member since 2006-11-23)
 (BOB member since 2007-07-11)