Hi everybody,
I am still migrating some Reports from BO 6.5.1 to BO XI. At the moment I have a report here with a chart which is based on a table having rows from 0 to 10 and columns from 0 to 10, so I got 121 data fields. In a second table I’ve got the same fields with their percentage of the sum of the Row. Now in the Chart I want only to see the the bars of the percantages of row 0.
In the old Version it worked this way: =Wenn([Score Klasse A]=0;Prozent([Anz_RisikenV];Spalte);-1)
Wenn is equivalent to If, Prozent to Percent, Spalte to Row, its the german version ![]()
Then I get a chart with 10 balks plus the values if I check them.
In XI its more difficult…
By using: =Wenn([Score Klasse A]=“0”;Prozent([Anz_RisikenA];Spalte);-1)
I get the balks of “Score Klasse A = 0” corretly, but all others are -1 (-100%)
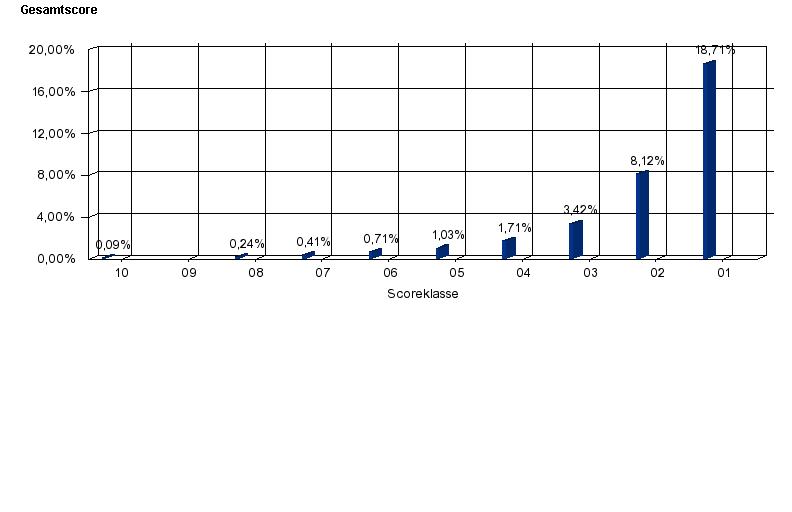
By using: =Wenn([Score Klasse A]=“0”;Prozent([Anz_RisikenA];Spalte);0)
I get only the balks that I want - perfect. But if I turn on the values, all 121 are shown, 110 of them are 0.
Question: Is there anything like “null” in XI that I could use in this Situation?
I cannot use filters, because they would change the percentage values.
Thanks in advance
-CoMar

MaCof ![]() (BOB member since 2007-09-13)
(BOB member since 2007-09-13)