Hi all,
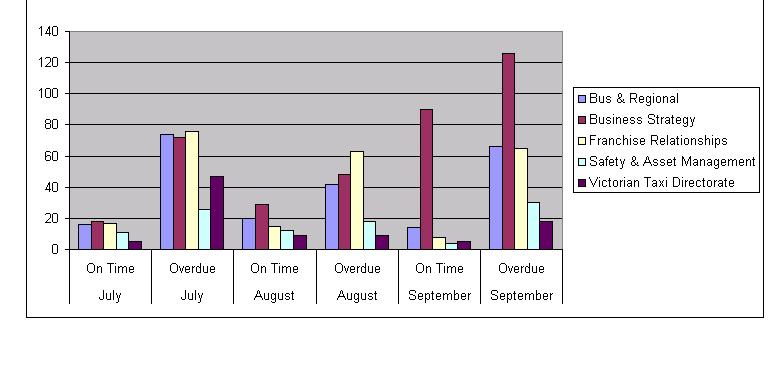
I’m having trouble building a chart as per the attached screen cap. I’ve got all the required numbers in my report but I can’t seem to get the grouping correct in order to build the chart. Basically on the x axis I’ve got a group and then that’s split into sub groups. Hopefully the attached file will make it clear what I’m trying to do.
Cheers
Keith
It looks like you might be trying to use 3 levels of grouping in the chart: month, on-time/overdue, and whatever the legend shows (dept?). The graph in Crystal will only handle two-levels. I’d suggest creating a formula that combines the first two levels into one label such as “Aug - On time”. Then you can use this and the field in the legend to build your bar chart.
Thanks Iruka,
I’ve been trying to do exactly as you suggested but haven’t gotten it exactly right yet but at least your post tells me that I’m on the right track.
Cheers
Keith
Here is a sample of how to do it. I am taking liberty with the data as I do not have specifics. Let me know if you have any questions on it. Forum Charting Help.zip (20.0 KB)
 (BOB member since 2008-07-15)
 (BOB member since 2008-02-18)