I often find myself trying to map how a column is used over the course of a dataflow. Is this something that metadata reporting would help me with? I’ve experimented a little with querying the repository tables and views, but nothing more formal.
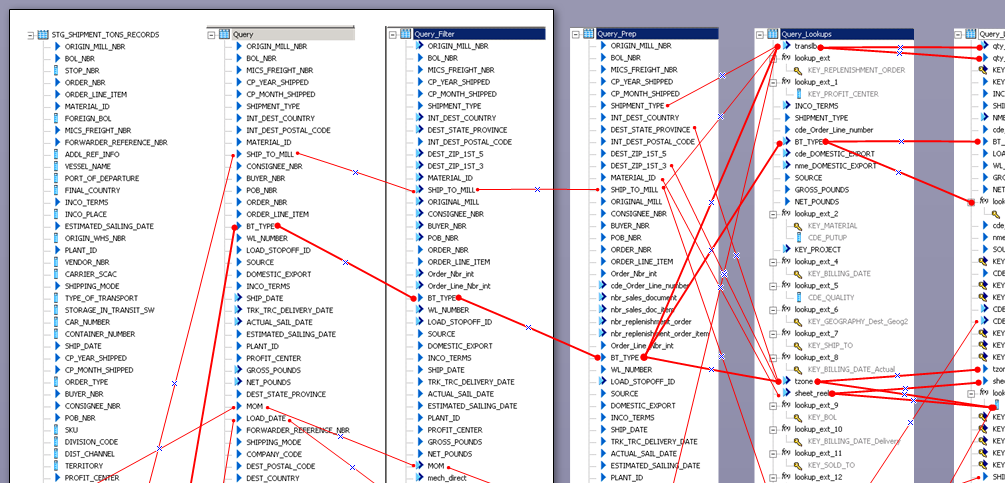
Ideally, it would be great to see it graphically. I used to use Informatica, and I miss the view that tool provided showing the transforms opened up, with lines showing the field dependencies. You could even have it highlight the path forwards or backwards from any given transform column. I’ve attached a picture of a diagram I’ve started in Visio for one of my dataflows, following the Informatica style, but of course putting it together manually is time-consuming, and would be impractical as a regular documentation method.
Even a spreadsheet showing each column link between each pair of transforms would be great. I tried querying the repository tables for this, but didn’t get very far. Is that possible to get that information from repository queries, or from some metadata tool? Any pointers are appreciated, thanks.
JohnBrooking (BOB member since 2009-12-22)
