Hi Gurus,
I have data that looks like this:
Date Region Country S_Name C_Offered Ans_Within_SL SL%
6/2012 APAC Australia x 555 516 87%
6/2012 APAC Australia VIP y 19 17 94%
6/2012 APAC India c 2356 2238 100%
6/2012 APAC India VIP i 548 509 99%
7/2012 APAC Australia d 586 514 90%
7/2012 APAC Australia VIP v 15 12 100%
7/2012 EMEA United Kingdom aa 39 35 94%
7/2012 EMEA France cc 5000 4655 94%
8/2012 EMEA Germany dd 2 0 0%
8/2012 EMEA France ee 28 15 94%
8/2012 LAT Peru ghj 3700 3351 87%
9/2012 LAT Brazil kjh 10 10 77%
9/2012 LAT Brazil lki 1500 1400 90%
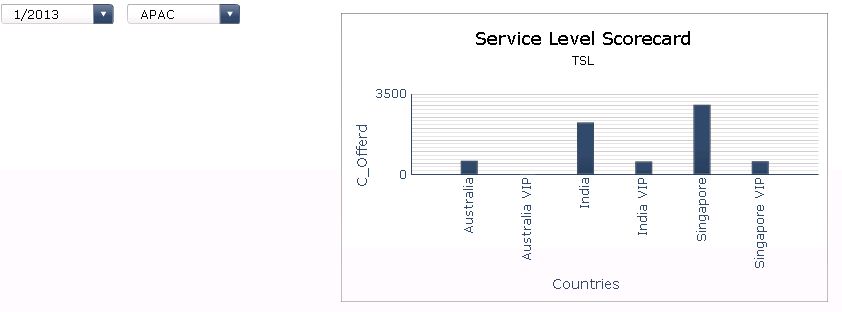
I am designing a chart based on this data for Country Vs. C_offered, Taking prompt as Date (Months) and Region.
For Prompts i am Using Filter Component, But in Destination it is giving one Country, Like Australia for APAC Region.
Please help me to design this requirement(Please find the attached image).
Thanks,
Saurabh

Saurabh Upadhyay  (BOB member since 2012-09-25)

 (BOB member since 2012-09-25)