If you have standard TIME Dimension table, you can merge month column between TIME dim and you table which will generate a list of all the months with or without data.
You need to describe what you tried and how the results were different from what you expected in order to get better help. The link as provided does work. Are you using sections in your report?
I show this dimension month on the report with the amount.
At the moment I only have amount until April, but the customer want to see all month in the report with amount or not.
Like: Jan Feb Mar Apr Mai Jun Jul Aug Sep Oct Nov Dec
11 12 13 10
But I don’t have data for months after Apr, and I don’t know how can I create these empty months.
I tried to created another query with other dimension months, but If I merge the dimension, only appear until Apr, and If I don’t merge, I have one error.
What do you mean?
Can I create a list of values - months? And use for this?
When you create a second data provider, yes, it will merge the values. But try this: open the merged value and select the “full month” version, meaning the one from the second data provider, and use it for the value in your crosstab.
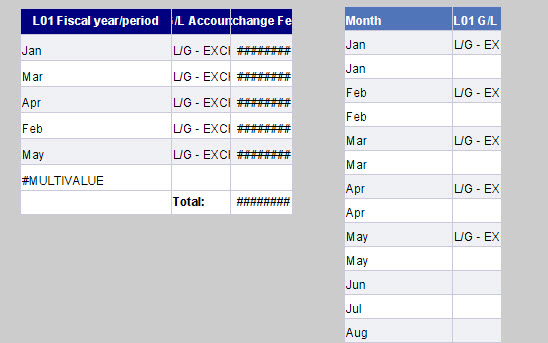
I need to show all month in one year, with value or not. (second table in the attachment), but I cant have two lines/rows for the same month.
When I have more line for the same month, I only need to show the line with value/data.
I tried to use this:
=If(Previous([Month])<>[Month]) Then [Month]
But the BO only show me jan, feb, mar, apr and may, and put all other in one row null. (I show in the attachment the first table).
 (BOB member since 2003-11-27)
 The link as provided does work. Are you using sections in your report?
 (BOB member since 2002-06-06)
 (BOB member since 2009-02-18)