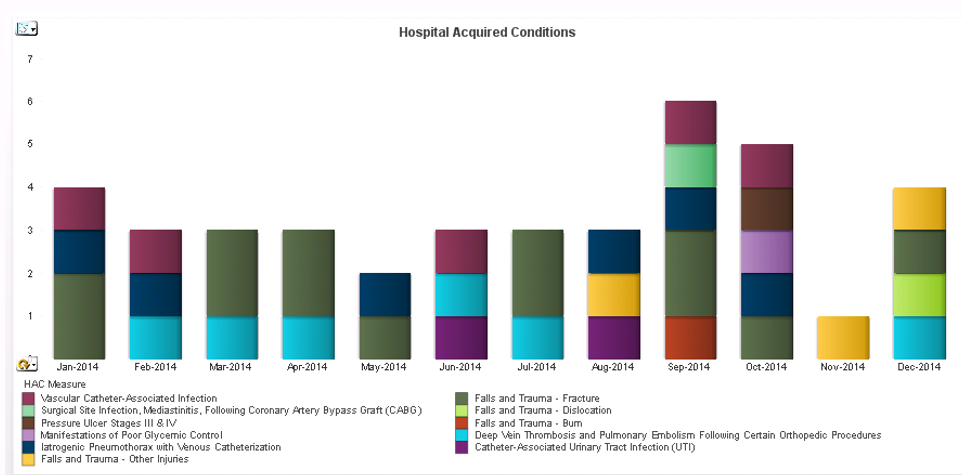
Each time I select the stacked bar graph with 2 X axis dimensions (mthyr and service categories) and 1 measure I get a side by side bar chart. I need stacked by services showing my monthyr once for each period. Is this not possible?
I attached what I am trying to get to and what I am actually getting with the data I have is not a stacked bar.
Go to Format Chart -> Value Axis -> on the right hand side you’ll see Stacked Chart or Globally Stacked Chart, one of that should do the trick> But it didn’t work for me when I first created a Column chart, and then used right click -> Turn to -> Stacked Column Chart option.
So, I updated the Assign Data properties by moving a dimension by which I wanted to Stack, in the Region Color option.
 (BOB member since 2010-06-16)