Hello,
I was wondering how i can display the total count on the x axis on a bar chart?
So the bar chart will show the following:
February March
363 Count 380 Count
Any assistance would be greatly appreciated. thank you.
phong919 (BOB member since 2009-02-25)
Hi phong919,
Did you mean to show the data values on the bar chart ,in that case
try by following the below procedure.
Choosing chart data display options
show/hide the values for the data on each chart bar, line, or marker
select a specific color for the primary data series (that is, for the bars, lines,
or markers that display the first measure on the chart body)
show/hide data markers on Line charts, Bar and Line charts, and Radar
charts
show/hide charts when there is no data for the dimension(s) or measure(s)
on the axes
Showing/hiding data values
To show/hide data values:
- Make sure you are in Report View.
The Edit Report button is pressed in when you are working in Report View.
- Select the chart.
- Click the Properties tab, and then click the Chart Format sub-tab.
Or
Right-click the chart, then select Edit Format from the shortcut menu.
- Under Apply To, click the arrow next to the list box, and then select Chart
Data from the list.
- To show the data values, select Show data values.
Or
- To hide the data values, unselect Show data values.
The data values are shown or hidden on the chart, according to your
selection.
GNK_BO (BOB member since 2007-07-17)
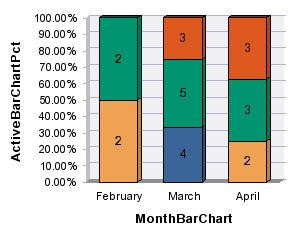
I tried the following stated and i can’t get the bar charts to look like what i want it to be…
I’m including an attachment and i hope this will help with my requirement.
The bar chart chose is vertical percentage. So for February it shows 2 and 2…i wanted to display 50%/50%. and for march also in percentages and so forth.
I’m not sure how to get this chart to show the appropriate values

phong919 (BOB member since 2009-02-25)