Hi,
Im new to SAP dashboard, I got a quest to create dashboard report with drill down from montly to weekly.
montly prod loss
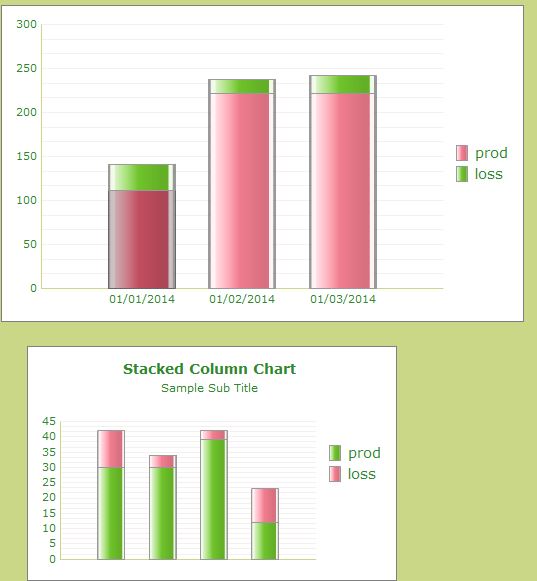
01/01/2014 111 30
01/02/2014 222 16
01/03/2014 222 20
weekly prod loss
1 30 12
2 30 4
3 39 3
4 12 11
5 80 1
6 30 4
7 60 6
8 52 5
I’ve attached currently dashboard setting up. when click 01/01/2014, then the second chart show weekly 1, 2, 3, 4 data; when click 01/02/2014, then the second chart shows weekly 5, 6, 7 8 data.
Could any one help on this. much appreciated.
Many Thanks,
Youqin

youqinweng (BOB member since 2014-05-06)