Pretty new to creating reports in Web Intelligence so I appoligise in advance if this is overly simple, I’ve had a search and can’t find the answers to what I’m looking for.
I’m reporting on the number of incidents open and closed in a given month so ideally I’d have data that looked like this;
Open Sept Closed Sept
Sev 1 10 9
Sev 2 25 27
And so on.
I can get both to display individually as crosstabs and appear fine, however when I drag the two months into one crosstab I get multiple months for one of the columns and can’t see an obvious way of grouping them together.
I want to go on to graph the results if possible so trying to avoid using any of the work arounds I’ve dream’t up so far!
Sorry if I’ve missed any info off, or if its an overly simple question!
Sorry been staring at it so long I can’t even explain it properly.
What I have is a table of data that has multiple incidents, and lists the month the call was opened and the month it was closed and what priority that call was.
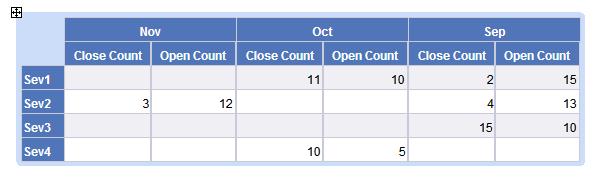
What I’d like to produce is a cross tabs that shows these calls grouped by priority down the left hand side and then group along the top by month showing two counts per month, one for calls opened, one for calls closed.
I can produce the cross tab for calls opened or calls closed and it displays as intended, if I try and show both on the same crosstab (that I then intend to chart) it all goes horribly wrong. Looking at the crosstab now, I have 8 columns for April and can’t really figure out why. I’m guessing its because not all calls are opened and closed in the same month, but could be wrong.
Should be simple, coming from a Crystal Reports background its a 5 minute crosstab that I can’t help but feel I should be able to figure out!
I had a similar situation to yours. I can just say you that try to have two cross tabs
In first cross tab just put open month on top and left objects will be all you want as in rows.
Now in second crosstab just put closed month on top and all left objects here also. In this crosstab, please right click this table and make sure you had opened the format table. If you dont know about how to have table selected as not any cell as their are good chances that you may end up selecting cell. Take your cursor to outer borders of the top header or any way outside. Now when you right click, you may have format table option in the list and then go into it. Their will be one option to hide left header. Tick it and now do its relative positioning with respect to first crosstab
I am assuming as you are from crystal reports background, you will be able to do this.
Can you just provide me some lessons on how to work on crystal as beginner and some tips/advice
Thanks, I’ll give it a go, but was hoping to get it into one as next I want to chart it, so figured if I can’t get it right on the one crosstab I’ll never get it right on a line graph!
Plus, if I could nail it in the one for opened and closed, I’d be half way there when they inevitably come back and ask for additional dates to be added for events inbetween opening and closing!
Crystal is a piece of cake in comparison I’m finding! But will gladly try and help if I can!
First place all the left ones and the on top column right click and insert a row below.Now on top most row place your object pf month
Now on 2nd row we have just created(inserted to be exact) click on its column cell and then insert new column
Now you can have the structure as shows by TBTS. Just place your open and close in 2nd row these columns.
Sorry it doesn’t work for me, I don’t doubt my biggest problem is somewhere between the chair and keyboard!
But when I click on the second row to add the new column, I don’t get the merged column on the top row, I get a 2nd additional column.
Plus I think I still have issues by perhaps not having a suitable month column to group by.
But it looks exactly how it did orginally and nothing like TBTS screenshot.
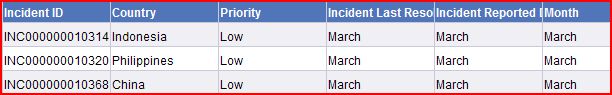
I’ve also added a sample of my data, so in that case I’ve tried a stack of ways to get that to say March, Sev4 (or Low as it is now) - 3 open 3 Closed the far right column is a variable I’d been playing about with to try and give me a month to group both the opened and closed columns by. I’ve been doing distinct counts on the Incident number using things like merged dimensions to distinguish counts between opened and closed incidents etc.
Shrek, IF you need TBTS screenshot type work, then you are only mising now to merge on top row.
You are getitng two columns their right? So now what you have to do is select both column ysing Ctr key and right click and merge on top row and then after you have to place month object.
TBTS: Please correct me if i am wrong and let this problem solved out