In a crosstab, once I have my Year in the Row, and Month in the Column, and I drop Reveue in the body, all is good. The moment I drop Quote, it splits each year in to Revenue and Quote and gives me an output like this.
I dont think you can achieve the desired format in a single crosstab block. you might want to split it into two crosstabs - one with Revenue and one with Quote. You can remove the header from the second crosstab and position the two blocks to make them appear as one.
Thanks Vinod for the reply. I cant remove the header row (which is Month) from the 2nd block beacuse if I do so, the data gets compressed in to 1 column showing the aggregated amount for the year as opposed to the split by month.
How are you ‘removing’ the header? Do you just remove Month from the crosstab per se? Or do you go to the crosstab properties and uncheck the ‘Show Header’ property? If you do the latter, it shouldn’t compress to one column.
I dont want the Revenue to apprear 3 times, rather I want it to appear once,as if I apply BREAK and center it. For some reason when I click this column, the BREAK button is disabled. Any trick to acheive this.
So my desired output should be:
Year Jan Feb Mar
2008 10000 20000 250000
Revenue 2009 12000 220000 270000
2010 5000 15000 20000
2008 11111 16666 31111
Quote 2009 12222 15666 19999
2010 13333 15555 20000
I cannot open your document, but very curious to know what content it has.
But are you saying, in WEBI we can get a report as I have outlined.
A measure, split up with respect to Years , and have moths in the header row rather than having all measures each evaluated for one year , and then again all the measures evaluated for another year,so on.
Similarly, my rest of the measures will have to be arranged as above.
Looks I have to create seperate blocks for each measure and arrange them closely to get my output.
This is tedious approach and I dont know if there is any simpler way.
FYI - I have been doing BO developement and Universe design for quite sometime now, so I’m 100% sure on the definitions of dimensions and measures,
when you said “Measure Types” in your post, I didn’t know what you were referring to, but looks like you meant how would I analyse my measures -Ofcourse by “DIMENSIONS”.
What I expected when I posted this topic is If I could get some advise on this particular report formatting.
Anyway, I’ve checked Horizontal Table as well, it doesn’t suffice my need.
 (BOB member since 2007-04-09)
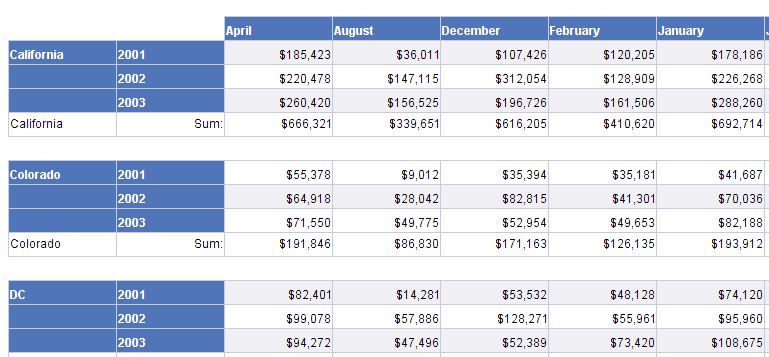
 (BOB member since 2006-03-30)
 (BOB member since 2002-08-20)