system
1
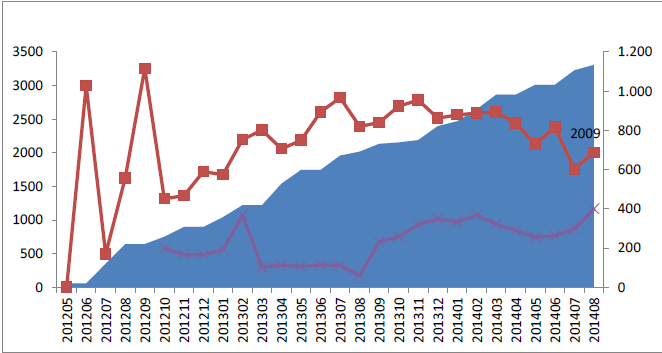
Where can I find some hints on producing a combination graph?
The columns represent the value for each month, but there is also an area element with the cumulative effect.
Something like this…
Maxcot (BOB member since 2017-12-06)
MarkP
2
Follow this, but change your region types in the dialog boxes to area instead of line.
Oops! Here’s the link:

system
3
Hi Mark,
You can use the idea behind my blog, and you’ll probably need 2 charts overlapped.
https://blogs.sap.com/2019/02/22/displaying-sum-or-total-on-top-of-a-stacked-column-chart-in-webi/
Another blog where I used 2 measures at different axes.
https://blogs.sap.com/2016/04/08/sum-avg-lines-in-chart/
M H Mohammed  (BOB member since 2010-06-16)