Hello,
i use BO XI R2.
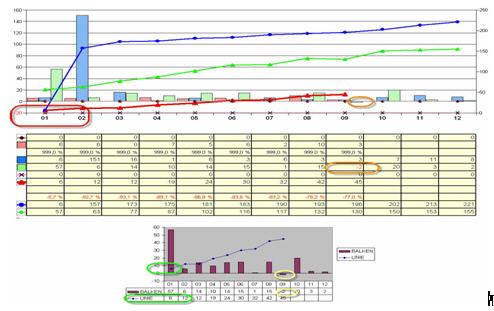
I have created a chart, a combination from column and line (see the attachment).
The problem is that in the column month 9 i have a minus value.
This figure (column) pictured correct but the line figure started on the Axis scale -20. Is it possible that i define that the starting base for the line figure is Axis scale 0.
The second graph in the attachment was created in Excel and this looks better (only as example).
Thanks for your answers.
Christian
![]()
chroalja (BOB member since 2007-01-26)