Hi,
Can anyone please tell me how to use text field in X Axis of bubble chart?
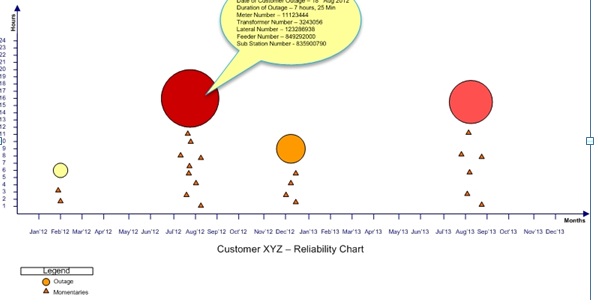
(Labels as jan 12 ,Feb 12 ,March 12 and so on).
I am not able to do the same ?
And also i need to show some text on mouse over on Bubble rather than co ordinate values ?
See attachment…
~Saurav
sadwi ![]() (BOB member since 2012-09-07)
(BOB member since 2012-09-07)