Hi. I have very hard question for me. Maybe you may help me please. I can post only 1 image, thats why I attach it below with three tables on it.
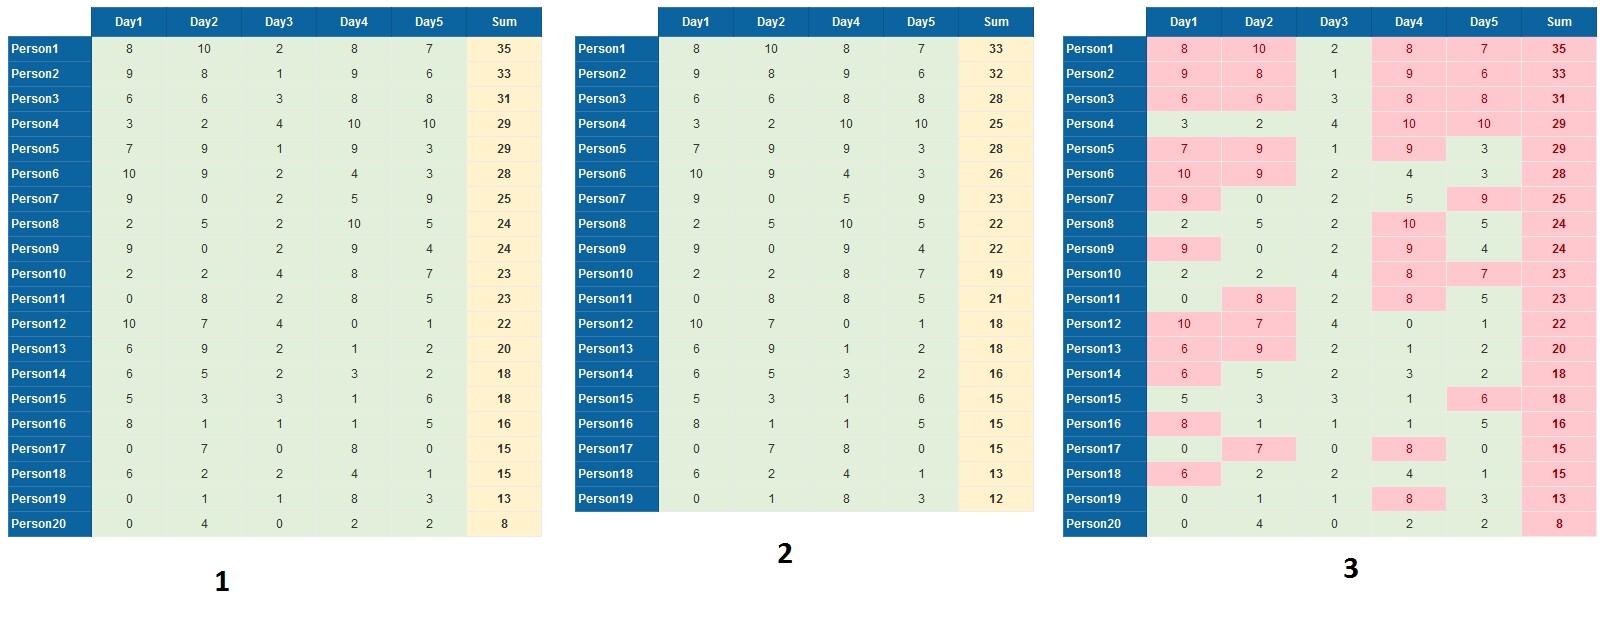
There is a crosstab which looks like this (it is just example) - see “1” on attached image.
Columns:
Day1…Day5 - sum of purchases by specific person for every day
Sum - sum of purchases by specific person for 5 days
Rows:
Person1…Person 20 - every person who bought something within 5 days
Measures:
Green cells - Count([Purchase])
Yellow cells - Sum(Count([Purchase]))
I need to show only those who have more than 5 purchases. I apply filter at whole table: Sum(Count([Purchase])) > 5 and get this result (see “2” on attached image).
As you may notice, Day3 disappeared from crosstab because there were no purchases more than 5. And sum of purchases has changed for every person.
Moreover, Person20 dissapeared too because every day he made less than 5 purchases. But sum of his purchases is more than 5!
Here is a screenshot with conditional formatting (value in cell more than 5) for more understanding (see “3” on attached image).
My question: is it possible to filter crosstab by sum column first but without touching others?
Just to be clear, which customers do you want to show? Only those that have any day with a purchase count greater than 5, so that just person 20 is not on the list but still show all sales for everyone?
I want to show all customers that have sum of purchases greater than 5.
5 is just example here. And as you see, if I apply this number then one row and one column disappears.
You should be able to set the cross table properties to show days with no sales across the top. “Show columns with empty measure values” is the one you’re looking for
Thanks for response, but this is enabled and this is unhelpful. I found another solution.
You need to create dimension in universe - count(purchase) over partition by(person). Then add it in objects in report. Then apply filter by it for table.