Hi BOBJ users. In this time I have a requirement.
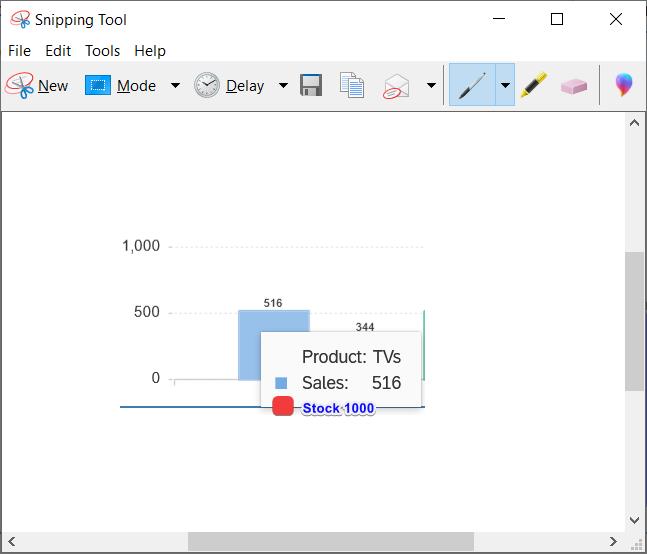
In a bar chart, It should show two measures values in the data labels, actually It has one value “Sales: 516” so It must one more measure e.g. the red box with “the stock 1000” value without add extra bar.
I don’t think tooltips will work quite as you hope.
Usually a measure needs to be displayed in order for it to gain a tooltip.
You might be able to play around with the second axis (still have it the same value range as the first axis) and use some sort of overlap technique. Display the red on the first axis with the sales, but then have a stock and unsold stock measure on the second axis (with unsold stock in white, as =[stock] - [sales] and stock in blue, same as your original axis so that it covers the original axis measures on the chart). It might not even work, but could be worth ten minutes to see what you can come up with.
I try to with color dimension and it works but the colors change over and over again while the filters is applied, so the other way is the value as dimension on the x axis ¿is possible to hide the value dimension in bar chart?