I added a sample because this is really hard to explain in only words.
So 2 tables. On the left my current situation and to the right what I am trying to achieve (and failing…)
On the left EoMDate is a last day of the month formula on posting date.
But as you can see for this material there was no “action” in months 8, 9 and 10 for 2020.
That is ok but as you see I put this inventory in Aging buckets. And we want to put this in a graph.
For this to work we need the report to also show months 8, 9 and 10 with the same inventory level as where it stopped in month 7 (so 30-60-60-60-60 and so on…)
Now on the right I tried to overcome this problem by using TimeDim on the posting date.
It worked so far that I also now got dates for months 8, 9 and 10 (in 2020).
Unfortunately I get of course a date for every day in those months.
Tried fixing that with the LastdayofMonth formula but this just gave me multiple times the last day of that month and does not aggregate.
So then I pinpointed every start of a new month thinking to then filter out all lines with X.
As you maybe can see in the picture for the new months the YTD amount will be fine then.
But the months that do have amounts will not have that amount always on the first line (see month 7).
This way I will filter out the amount for month 7 plus that I get the wrong YTD amount for month 7 (30 instead of 60).
And yes now I am lost .
Hoping that somebody can explain how I can solve this issue?
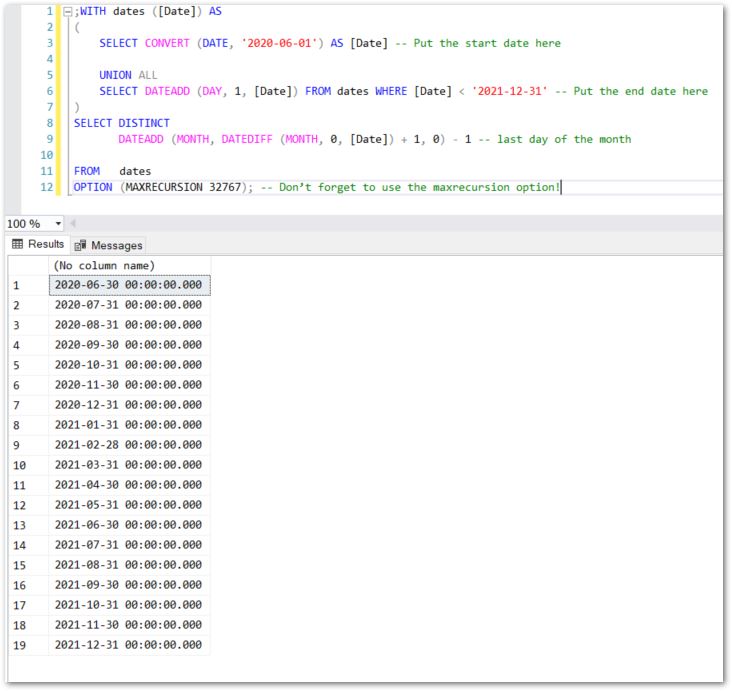
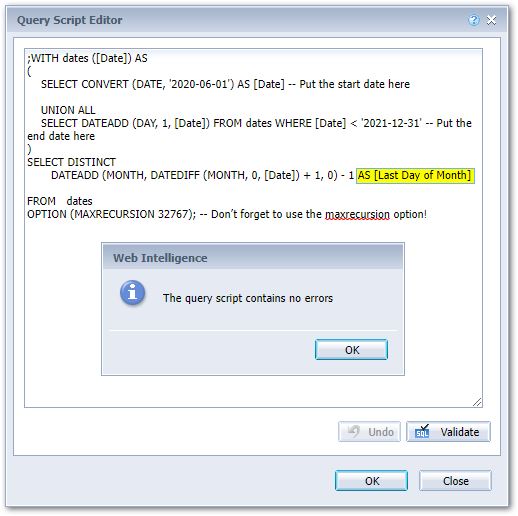
I would prefer to put the code here as text, but I cannot seem to make the formatting work such that when you copy it the quotes and comments are not messed up. You can get the query text from here.
Now you can merge month-end dates from this query with the date in your query.
Thanks Noel for your reply.
But I never knew you could write your own code in Business Objects and make a table like that what you then could link to an existing query.
Where would you put that code?
Anyway I have been thinking this over and I am fearing it will never work.
Like there was no input for the month that had no data.
Even when I would get in the date there still would be no input for things like material, batch, use before date, quantity.
So then I would have an end date for that month but to calculate in what aging bracket the line for that month belongs I still would need to have the use before date of that month to compare it with my new created date. And also the quantity for that line should be there.
Its frustrating because on paper the solution would be so simple
If there was no data for the selected fields in a month the fields should be the same as the previous month.
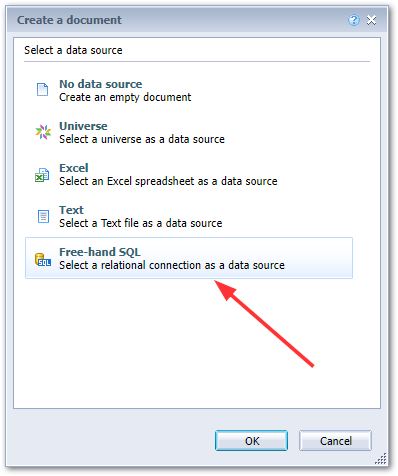
So I used another free-hand SQL query to mock up some sample data.
SELECT CONVERT(DATE, ‘2020-06-30’) AS [EoMDate], 30 AS [TotalQty]
UNION
SELECT ‘2020-07-31’, 30
UNION
SELECT ‘2020-11-30’, -20
UNION
SELECT ‘2020-12-31’, 75
UNION
SELECT ‘2021-02-28’, -46
UNION
SELECT ‘2020-07-31’, 30
UNION
SELECT ‘2020-07-31’, 30;
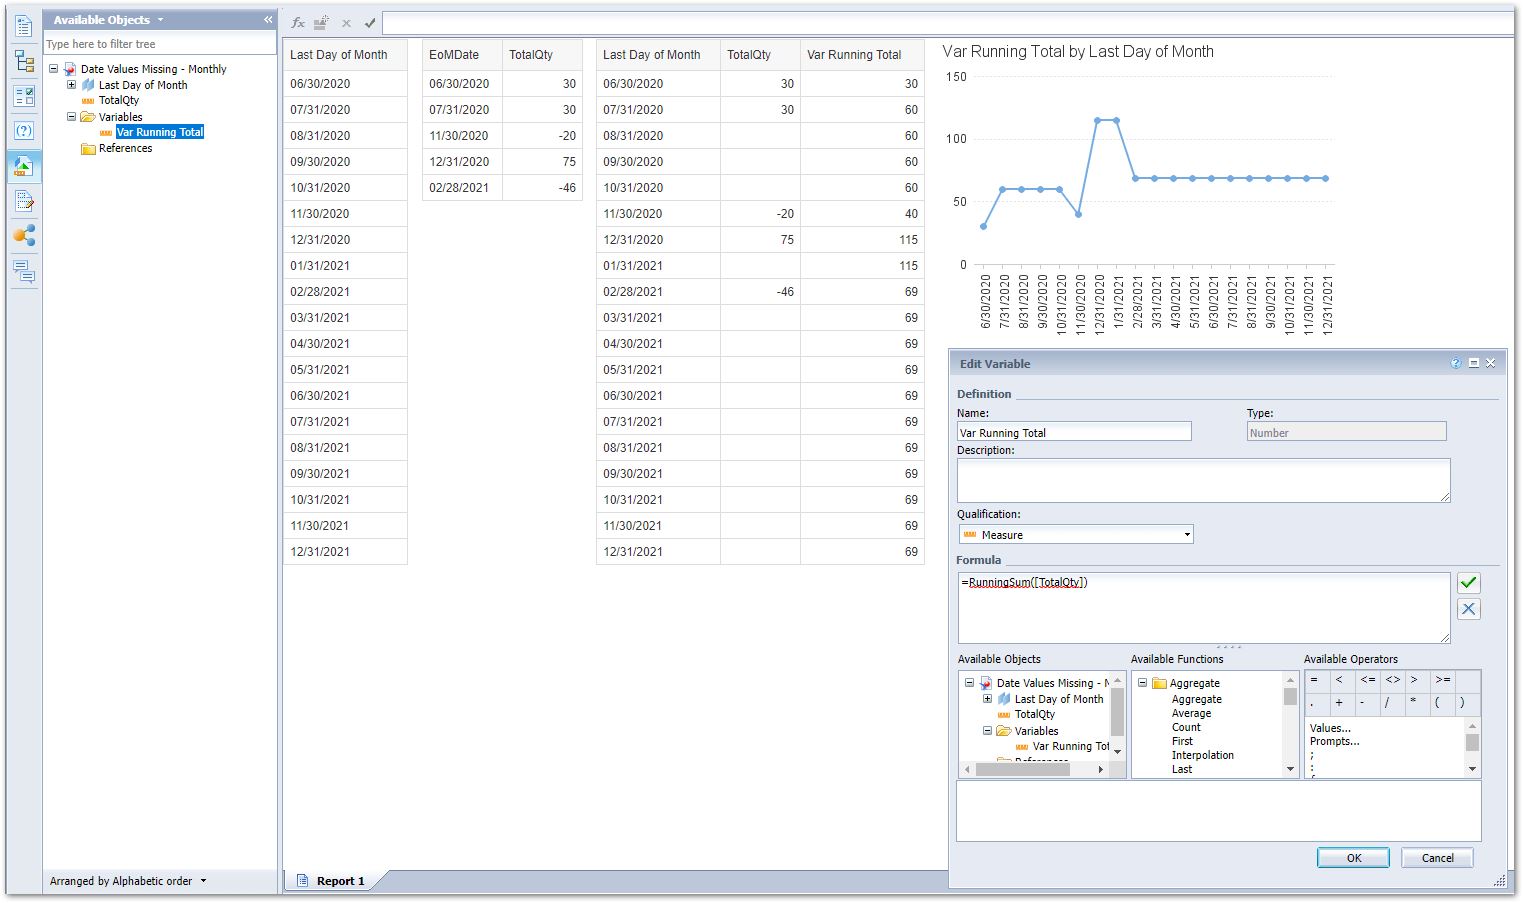
Now I run that along with the query that gives me the month-end dates. I merge those two query on their date. Next I created a Var Running Total variable…
=RunningSum([TotalQty])
Now put the merged date dimension and this newly created variable in a new table to see what you have. You can then turn it into a chart.
If you have access to the database you can create a VIEW that contains all the months for “current year” and another for “previous year” (or whatever you need for your reports) and then add those views to your Universe. That way users that don’t know SQL can also benefit from that for their reports.
Sorry for my late response.
And this solution is really interesting and that graph is really looking promising.
However I kept my previous example relative simple.
There are some more fields involved.
I will include a second example. To the left a more detailed view of the BO report.
And to the right some explanation how the solution would look in “excel style”.
So all the lines in blue color (the fields) will not be there for that given month.
That is why I think we could not achieve what we want.
And yes on the high level it looks good and we even could use it but there is 1 field that is rather key for the business.
We want to show the aging of our inventory.
That gets determined on a batch level.
So I tracked the first batch and when no new units of this batch come in or go out, nothing happens on that batch.
However of course this batch does age! When we start in june and july that batch belongs in the bracket 16-18 months.
But in those months nothing happens it gets older and those months should show it then in bracket 13-15.
And this process of aging will of course be the case for every material and batch combination.
So then you would have to calculate your running total on that lower level I guess.
But as said these blue fields are not in for the months that nothing has changed in the data.
We would use this BO data download as a source for Power Bi where we then would want to make a stacked column chart on our inventory by month with aggregated aging buckets.
(so 100% divided by the several buckets at that moment in time based on the aging of the batch)BoB Example v2.pdf (221.0 KB)
Can you get a list of months in a query in Webi from the universe? It doesn’t have to be from a SQL query, just a list of months that you want. They can then use the same prompts as your main query but with no measures, there is no join to the fact table restricting the date dimension. Then you can merge the two queries (if they haven’t merged already).